|
Size: 4772
Comment:
|
Size: 6401
Comment:
|
| Deletions are marked like this. | Additions are marked like this. |
| Line 1: | Line 1: |
| #acl MartinGade:read,write,delete,revert FEW3OGroup:read,write All:read | ## page was renamed from FEW3O #acl MartinGade:read,write,delete,revert KFEW3OGroup:read,write All:read |
| Line 4: | Line 5: |
| = FEW³O am IfM = FEW³O steht für '''Fe'''rnerkundung von '''W'''echsel'''w'''irkungen an der '''W'''asser'''o'''berfläche. Mitglieder der Gruppe beschäftigen sich mit Messungen von Austauschprozessen im Labor (Windwellenkanal), mit Feldmessungen der Radarrückstreuung von der Meeresoberfläche oder mit der systematischen Analyse von Satellitenbildern, vor allem von Radaraufnahmen küstennaher Seegebiete. |
= KFEW³O at IfM = KFEW³O stands for '''K'''üsten-'''F'''ern'''E'''rkundung und '''W'''echsel'''W'''irkungen an der '''W'''asser'''O'''berfläche (Coastal Remote Sensing and Interactions at the Water Surface). Our research is building up on satellite imagery, particularly on synthetic aperture radar (SAR) imagery of coastal regions, on field campaigns involving measurements of the radar backscattering from the sea surface, and on lab experiments in the University's wind-wave tank. |
| Line 10: | Line 11: |
| == Windwellenkanal == Der Windwellenkanal der Uni Hamburg wurde in den frühen 1970er Jahren gebaut und befindet sich auf dem Gelände der Bundesanstalt für Wasserbau, Außenstelle Küste, in Hamburg-Rissen. Hier wurden Messungen zur Wellendämpfung durch monomolekulare Oberflächenfilme, zur Radarrückstreuung und zu Transferprozessen an der Grenzfläche Wasser/Luft durchgeführt. Der Windwellenkanal dient heutzutage vor allem der Ausbildung (Ozeanische Messübungen) und der Lehre (BSc- und MSc-Arbeiten). |
== Satellite Imagery == We are regularly analysing satellite images, particularly those acquired by synthetic aperture radar (SAR) sensors. These high-resolution active microwave sensors are used to derive oceanic processes and phenomena from sea surface roughness variations that manifest in spatial variations of the SAR image intensity. Below is a list of recent and actual studies based on systematic analyses of large numbers of SAR data. |
| Line 13: | Line 14: |
| [[FEW3O/WWK|{{attachment:WWK_gr.jpg|FEW3O/WWK|height="50"}}]] Zu den Wiki-Seiten des WWK geht's [[FEW3O/WWK|hier]]. | . [[KFEW3O/SARWatt|{{attachment:Sat_AL2.jpg|SARWatt|height="60"}}]] '''Sediments and habitats on exposed intertidal flats.''' . Variations in the normalized radar cross section at different radar bands and polarizations can be used to gain information on the distribution of various sediments and on the location of habitats on dry-fallen sandbanks. To learn more about our studies performed together with colleagues from Bergedorf, Tönning and Wilhelmshaven, Germany, and from Beijing, China, click [[KFEW3O/SARWatt|here]]. . [[KFEW3O/SARKulturspuren|{{attachment:Sat_TSX.jpg|Kulturspuren|height="60"}}]] '''Archaeological studies.''' . High-resolution SAR imagery can be used to detect remnants of historical land use in areas that were lost to the sea during major storm surges. Foundations of former farmhouses as well as systems of ditches of former drainage systems can be identified of SAR imagery, whose spatial resolution is below 1 meter. These studies are performed together with colleagues from Hamburg and Tönning, Germany. To learn more click [[KFEW3O/SARKulturspuren|here]]. . [[KFEW3O/SARCoastChange|{{attachment:Sat_ERS.jpg|Coastal Changes|height="60"}}]] '''Coastal changes.''' . Large quantities of SAR images of the German North Sea coast are used to identify morphodynamic changes in the German Wadden Sea, thereby providing indicators for coastal changes in those sensitive environments. To learn more click [[KFEW3O/SARCoastChange|here]]. . [[KFEW3O/SARPollutionStats|{{attachment:Sat_Env.jpg|Statistics|height="60"}}]] '''Oil pollution statistics.''' . SAR images are already being used for the operational oil-spill monitoring. These images are used for comprehensive statistical analyses that allow, e.g., for an assessment of the mean oil pollution of dedicated coastal regions and its seasonal variability. Such analyses were recently done for Indonesian coastal waters. To learn more click [[KFEW3O/SARPollutionStats|here]]. . [[KFEW3O/SAROilHotspots|{{attachment:Sat_RS1.jpg|Hot Spots|height="60"}}]] '''Local pollution hotspots.''' . Long time series of SAR imagery can be used to identify frequent, or even continuous, oil pollution at certain locations, e.g. by leaking oil from a sunken vessel in the western Black Sea. Our analyses help in quantifying the overall amount of oil that has been leaking from the ship wreck, and in estimating the total damage to the local and regional environment caused by that oil leakage. Click [[KFEW3O/SAROilHotspots|here]] to learn more. . [[KFEW3O/SAREddies|{{attachment:Sat_S1A.jpg|SAREddies|height="60"}}]] '''Statistics of submesoscale oceanic eddies.''' . SAR images, along with data acquired by other sensors, can be used to detect submesoscale and mesoscale turbulent processes at the water surface and to identify their spatio-temporal variation. Collaborative studies have been performed together with colleagues from the University's Department of Informatics, from Moscow and Ufa, Russia, and from Liège, Belgium. To learn more click [[KFEW3O/SAREddies|here]]. ---- == Wind-Wave Tank == The University's wind-wave tank was built in the early 1970s and is located at the Federal Institute of Waterways Engineering in Hamburg-Rissen. . [[KFEW3O/WWK|{{attachment:WWK_Bild.jpg|WWK|height="60"}}]] '''Information on the wind-wave tank.''' . We have been performing measurements of wave damping by monomolecular surface films, of the radar backscattering from the water surface, and of exchange processes across the water-air interface. The wind-wave tank is also used for education such as student practicals and BSc-/MSc programs. . [[KFEW3O/WWKBASS|{{attachment:LDVlong.jpg|WWKBASS|height="60"}}]] '''Momentum and energy fluxes in the presence of surfactants.''' . We focus on dynamic processes that determine fluxes of mass, energy, and momentum across the SML. Since these processes take place at spatial scales of centimeters and below, we conduct novel, simultaneous measurements at very fine scales, well below the length scales of the dynamic processes under investigation. |
| Line 17: | Line 44: |
| Systematische Messungen der Radarrückstreuung von der Wasseroberfläche und ihre Auswertungen tragen dazu bei, die Rückstreumechanismen besser zu verstehen und Methoden zu entwickeln, aus dem Rückstreusignal ozeanische und atmosphärische Parameter abzuleiten. Messungen mit einem Scatterometer im Labor wurden bereits in den 1980er Jahren durchgeführt, in den 1990er Jahren wurden umfangreiche Messungen in der Deutschen Bucht von Hubschraubern aus durchgeführt. | Systematic measurements of the radar backscattering from the sea surface and their analyses contribute to a better understanding of backscattering mechanisms in general and to the development of methods to derive oceanic and atmospheric parameters from such measurements. Lab experiments deploying a scatterometer were performed from the 1980s, and they were complemented in the 1990s by field campaigns in the German Bight of the North Sea, deploying a scatterometer from board a helicopter and from a radar tower. |
| Line 19: | Line 46: |
| === Forschungsplattform FINO2 === Von Juli 2008 bis Oktober 2011 fanden auf der Forschungsplattform FINO2 in der Westlichen Ostsee systematische Messungen der Radarrückstreuung von der Wasseroberfläche statt. Fest installiert war dort die Plattformversion des Multi³Scat der Uni Hamburg, mit dem in 5 Radar-Frequenzbändern und 4 Polarisationskombinationen seit September 2011 rund um die Uhr Messungen gemacht wurden. Die Messungen fanden statt im Rahmen des nationalen Verbundprojektes [[http://sopran.pangaea.de/|SOPRAN]]. Einige Informationen zu FINO2 findet man [[http://www.fino2.de|hier]]. [[FEW3O/FINO2|{{attachment:FINO_gr.jpg|FEW3O/FINO2|height="50"}}]] Zu den Wiki-Seiten der Messungen auf FINO2 geht's [[FEW3O/FINO2|hier]]. |
. [[KFEW3O/Multi3ScatFINO2|{{attachment:M3S_FINO.jpg|Multi3ScatFINO2|height="60"}}]] More recently, longterm scatterometer measurements were performed from a research platform in the Baltic Sea. Some information is provided [[KFEW3O/Multi3ScatFINO2|here]]. |
| Line 25: | Line 49: |
| == Satellitenbilder == Regelmäßig werden Satellitenbilder ausgewertet, vor allem solche, die mit einem Synthetik-Apertur-Radar (SAR) aufgenommen wurden. Diese hochauflösenden aktiven Mikrowellensensoren werden genutzt, um aus räumlichen Variationen der Bildintensität auf Rauigkeitsvariationen der Wasseroberfläche und die dafür verantwortlichen hydrodynamischen Phänomene zu schließen. Das wird zum Beispiel genutzt zur Identifizierung von Oberflächenfilmen auf dem Meer und zur Klassifizierung von trocken gefallenen Wattgebieten (dort ist die Watt- und nicht die Wasseroberfläche Rückstreuer). .[[FEW3O/SARWatt|{{attachment:Sat_yel.jpg|FEW3O/SARWatt|height="50"}}]] Zu den Wiki-Seiten der SAR-Analysen '''trocken gefallener Wattgebiete''' geht's [[FEW3O/SARWatt|hier]]. SAR-Aufnahmen werden bereits für die operationelle Ölüberwachung genutzt. Solche Aufnahmen können statistisch ausgewertet werden, um dadurch z.B. Aussagen über die mittlere Verschmutzung bestimmter Seegebiete machen zu können. Hierzu findet beispielsweise eine Zusammenarbeit mit indonesichen Kollegen statt. .[[IndoNACE|{{attachment:Sat_li.jpg|IndoNACE|height="50"}}]] Zu den Wiki-Seiten der '''Statistischen Auswertung''' von Ölverschmutzung unter Verwendung von SAR-Daten geht's [[IndoNACE|hier]]. SAR-Aufnahmen können - zusammen mit Aufnahmen anderer Sensoren - genutzt werden, um submeso- und mesoskalige turbulente Phänomene an der Meeresoberfläche zu detektieren und ihre räumliche und zeitliche Variabilität zu bestimmen. Zusammenarbeiten auf diesem Gebiet gibt es mit Wissenschaftlern am FB Informatik, sowie mit Kolleginnen aus Moskau und Liège. .[[FEW3O/SAREddies|{{attachment:Sat_tur.jpg|FEW3O/SAREddies|height="50"}}]] Zu den Wiki-Seiten der Analysen '''submeso- und mesoskaliger Phänomene''' mit SAR-Daten geht's [[FEW3O/SAREddies|hier]]. === Satellitenbild-Datenbank === [[FEW3O/FEW3O_SatDB|{{attachment:Sat_gr.jpg|FEW3O/FEW3O_SatDB|height="50"}}]] Informationen zu den derzeit in der FEW³O-Gruppe vorhandenen '''SAR-Aufnahmen''' sind in einer [[FEW3O/FEW3O_SatDB|Datenbank]] zusammengefasst. |
== Internal Pages == . {{attachment:Grünpfeil.jpg||height=30}} [[KFEW3O/KFEW3O_intern|{{attachment:intern_r.jpg|KFEW3O_intern|height="30"}}]] ...to the Internal FEW³O pages [[KFEW3O/KFEW3O_intern|this way]]. . {{attachment:Grünpfeil.jpg||height=30}} [[KFEW3O/..|{{attachment:IfM_r.jpg|IfM|height="30"}}]] ...to the IfM page [[KFEW3O/..|this way]]. |
| Line 42: | Line 54: |
| == Allgemeines, Interne Seiten == [[FEW3O/FEW3O_intern|{{attachment:intern_r.jpg|FEW3O/FEW3O_intern|height="50"}}]] ...zu den Internen FEW³O-Seiten geht's [[FEW3O/FEW3O_intern|hier]]. ---- |
KFEW³O at IfM
KFEW³O stands for Küsten-FernErkundung und WechselWirkungen an der WasserOberfläche (Coastal Remote Sensing and Interactions at the Water Surface). Our research is building up on satellite imagery, particularly on synthetic aperture radar (SAR) imagery of coastal regions, on field campaigns involving measurements of the radar backscattering from the sea surface, and on lab experiments in the University's wind-wave tank.
Satellite Imagery
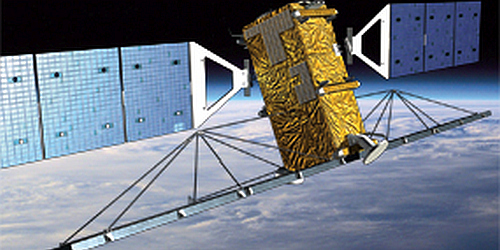
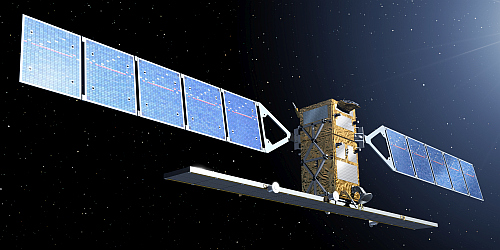
We are regularly analysing satellite images, particularly those acquired by synthetic aperture radar (SAR) sensors. These high-resolution active microwave sensors are used to derive oceanic processes and phenomena from sea surface roughness variations that manifest in spatial variations of the SAR image intensity. Below is a list of recent and actual studies based on systematic analyses of large numbers of SAR data.
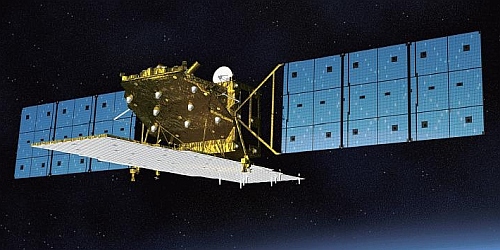
Variations in the normalized radar cross section at different radar bands and polarizations can be used to gain information on the distribution of various sediments and on the location of habitats on dry-fallen sandbanks. To learn more about our studies performed together with colleagues from Bergedorf, Tönning and Wilhelmshaven, Germany, and from Beijing, China, click here.
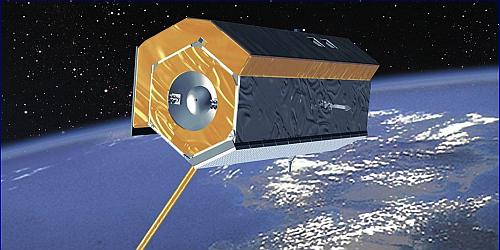
High-resolution SAR imagery can be used to detect remnants of historical land use in areas that were lost to the sea during major storm surges. Foundations of former farmhouses as well as systems of ditches of former drainage systems can be identified of SAR imagery, whose spatial resolution is below 1 meter. These studies are performed together with colleagues from Hamburg and Tönning, Germany. To learn more click here.
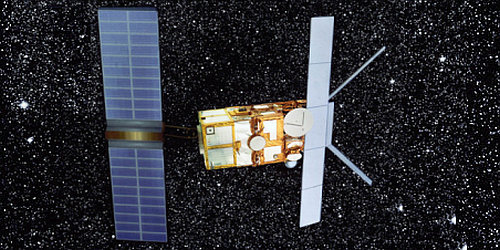
Large quantities of SAR images of the German North Sea coast are used to identify morphodynamic changes in the German Wadden Sea, thereby providing indicators for coastal changes in those sensitive environments. To learn more click here.
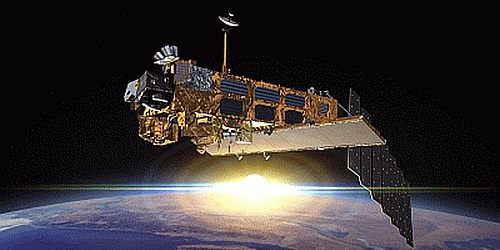
SAR images are already being used for the operational oil-spill monitoring. These images are used for comprehensive statistical analyses that allow, e.g., for an assessment of the mean oil pollution of dedicated coastal regions and its seasonal variability. Such analyses were recently done for Indonesian coastal waters. To learn more click here.
Long time series of SAR imagery can be used to identify frequent, or even continuous, oil pollution at certain locations, e.g. by leaking oil from a sunken vessel in the western Black Sea. Our analyses help in quantifying the overall amount of oil that has been leaking from the ship wreck, and in estimating the total damage to the local and regional environment caused by that oil leakage. Click here to learn more.
SAR images, along with data acquired by other sensors, can be used to detect submesoscale and mesoscale turbulent processes at the water surface and to identify their spatio-temporal variation. Collaborative studies have been performed together with colleagues from the University's Department of Informatics, from Moscow and Ufa, Russia, and from Liège, Belgium. To learn more click here.
Wind-Wave Tank
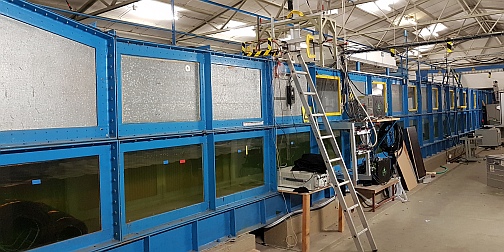
The University's wind-wave tank was built in the early 1970s and is located at the Federal Institute of Waterways Engineering in Hamburg-Rissen.
- We have been performing measurements of wave damping by monomolecular surface films, of the radar backscattering from the water surface, and of exchange processes across the water-air interface. The wind-wave tank is also used for education such as student practicals and BSc-/MSc programs.
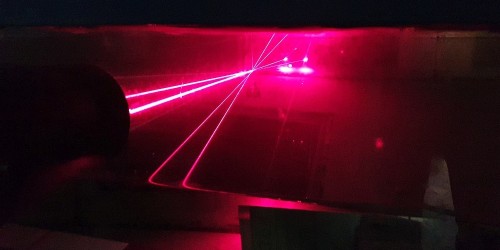
- We focus on dynamic processes that determine fluxes of mass, energy, and momentum across the SML. Since these processes take place at spatial scales of centimeters and below, we conduct novel, simultaneous measurements at very fine scales, well below the length scales of the dynamic processes under investigation.
Scatterometer
Systematic measurements of the radar backscattering from the sea surface and their analyses contribute to a better understanding of backscattering mechanisms in general and to the development of methods to derive oceanic and atmospheric parameters from such measurements. Lab experiments deploying a scatterometer were performed from the 1980s, and they were complemented in the 1990s by field campaigns in the German Bight of the North Sea, deploying a scatterometer from board a helicopter and from a radar tower.
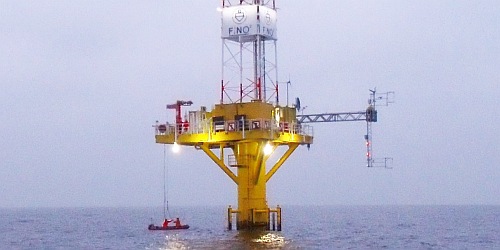 More recently, longterm scatterometer measurements were performed from a research platform in the Baltic Sea. Some information is provided here.
Internal Pages

