Fuellen der Luecken
   1 from scipy import *
   2 from pylab import *
   3 from scipy.ndimage import *
   4
   5 def interpolate_gaps(Z):
   6         ind_nan=isnan(Z) # Index of NaNs
   7         sy,sx=Z.shape[0],z.shape[1]
   8         Z0=Z.copy()
   9         ZY=Z.copy()
  10         ZX=Z.copy()
  11
  12         xi=arange(sx)
  13         for y in range(sy):
  14                 L=Z[y,:]
  15                 ind=isfinite(L)
  16                 X=xi[ind]
  17                 Y=L[ind]
  18                 tck=interpolate.splrep(X,Y,s=0.0) # Calculate coefficients at the supporting points
  19                 spl_int=interpolate.splev(xi,tck)
  20                 ZY[y,:]=spl_int
  21
  22         Z0[ind_nan]=ZY[ind_nan]
  23         return Z0
  24
  25
  26 z=rand(60,60)*10
  27 z=gaussian_filter(z,sigma=3)
  28 close('all')
  29 figure(1)
  30 z0=z.copy()# Original image
  31 z1=z.copy()# Original with missing values (set to zero)
  32 #z2 temporary dilated image
  33 z3=z.copy()# Reconstructed image with filled values
  34
  35 subplot(221)
  36 imshow(z,vmin=4,vmax=6,interpolation='nearest')
  37 colorbar()
  38 title('Original')
  39
  40 # Generate missing elements set to zero
  41 for i in range(30):
  42         s=int(rand(1)*10)
  43         ry=int(rand(1)*z.shape[0])
  44         rx=int(rand(1)*z.shape[1])
  45         z1[ry:ry+s,rx:rx+s]=nan
  46
  47 ind_zero=(z1==0).nonzero() # Index of elements that are zero
  48
  49 z2=z1.copy()
  50 z3=interpolate_gaps(z2)
  51
  52
  53 subplot(222)
  54 imshow(z1,vmin=4,vmax=6,interpolation='nearest')
  55 colorbar()
  56 title('Missing data')
  57
  58 subplot(223)
  59 imshow(z3,vmin=4,vmax=6,interpolation='nearest')
  60 colorbar()
  61 title('Filled gaps')
  62
  63 subplot(224)
  64 imshow(z0-z3,interpolation='nearest')
  65 colorbar()
  66 title('Difference')
  67 savefig('filling_gaps.png',dpi=50)
  68 show()
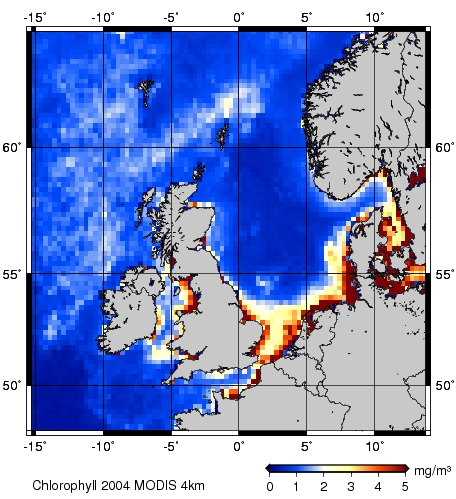
Erzeugung und Speicherung einer Testdatei für die gmt-Darstellung
Eine Erklärung zu diesem Programm findet man unter ChlorophyllArbeitsGruppe2 .
   1 from scipy import *
   2 import struct
   3 from pyhdf.SD import *
   4 from pylab import *
   5
   6 def read_CHLO(filename):
   7         # Oeffne HDF4-Datei
   8         f=SD(filename)
   9         # Hole die Attribute (Metadata)
  10         attr = f.attributes()
  11         # Hole die in der Datei verfuegbaren Datensaetze
  12         dsets = f.datasets()
  13         # Hole die Daten aus der Datei in ein scipy.array
  14         data=array(f.select('l3m_data').get())
  15         # Siehe attr:
  16         #'Scaling Equation': ('Base**((Slope*l3m_data) + Intercept) = Parameter value\x00',
  17         Base=attr['Base']
  18         Slope=attr['Slope']
  19         Intercept=attr['Intercept']
  20         data[(data==65535).nonzero()]=nan
  21         # Skaliere die Daten, um die urspruenglichen Einheiten zu berechnen
  22         data=Base**((Slope*data) + Intercept)
  23         return data,attr
  24
  25 def hdf_set(filename,z):
  26     hdfFile=filename
  27     f = SD(hdfFile,SDC.WRITE|SDC.CREATE)
  28     f.author = 'Lars Kaleschke'
  29     v2=f.create('z',SDC.FLOAT32,(z.shape[0],z.shape[1]))
  30     v2[:]=z.astype(float32)
  31     f.end()
  32     return
  33
  34
  35 filename='/pf/u/u243066/satdat/chlorophyll/Modis_2004_YR_chlo_9'
  36 img,metadata=read_CHLO(filename)
  37
  38 ##ECOHAM3/4-Gebiet ausschneiden
  39 ##ECOHAM3/4 Latitude:47.5833 to 63.9833, Longitude:-15.25 to 14.0833
  40
  41 ecolat1=63.9833
  42 ecolat2=47.5833
  43 ecolon1=-15.25
  44 ecolon2=14.0833
  45 latstep=float(metadata['Latitude Step'])
  46 lonstep=float(metadata['Longitude Step'])
  47 Nlat=float(metadata['Northernmost Latitude'])
  48 Wlon=float(metadata['Westernmost Longitude'])
  49
  50 lat1=floor((Nlat-ecolat1)/latstep)
  51 lat2=ceil((Nlat-ecolat2)/latstep)
  52 lon1=floor((abs(Wlon-ecolon1))/lonstep)
  53 lon2=ceil((abs(Wlon-ecolon2))/lonstep)
  54 img_eco34=img[lat1:lat2,lon1:lon2]
  55
  56 #Anpassung des Satellitenbildausschnittes auf Modellgitter:
  57 img_eco34_modgit=ndimage.zoom(img_eco34,(82./198.,88./353.))
  58
  59 #Speichern des angepassten Satbildes als hdf-Datei:
  60
  61 filename='testbild82x88.hdf'
  62 hdf_set(filename,img_eco34_modgit)
gmt-Darstellung
   1 from scipy import *
   2 import struct,pipes,os
   3 from pyhdf.SD import *
   4
   5 def hdf_get(filename):
   6     f = SD(filename)
   7     dsets = f.datasets()
   8     d={}
   9     for dset in dsets.keys():
  10         ds=f.select(dset)
  11         d[dset]=array(ds.get(),float)
  12     return d
  13
  14
  15 def write_grd(data,lat,lon,filename,I,R):
  16
  17     # Write to GMT/NetCDF .grd
  18
  19     grdtable,grdfile=filename+'.tab',filename
  20     pipe=pipes.Template()
  21     cmd='xyz2grd -V  -bis '+I+' '+R+' -G'+grdfile
  22     print cmd
  23     pipe.append(cmd,'-.')
  24     f=pipe.open(grdtable, 'w')
  25     sy,sx=data.shape[0],data.shape[1]
  26     for yi in range(0,sy):
  27         for xi in range(0,sx):
  28             f.write(struct.pack("f",lon[yi,xi])+struct.pack("f",lat[yi,xi])+struct.pack("f",data[yi,xi]))
  29     f.close()
  30
  31     return
  32
  33
  34 def gmt_map(data,outfile,title):
  35     Dlon=1.0/3
  36     Dlat=0.2
  37
  38     X=88
  39     Y=82
  40
  41     upper_lat=63.983
  42     lower_lat=upper_lat-Dlat*Y+Dlat
  43     western_lon=-15.25
  44     eastern_lon=western_lon+Dlon*X
  45
  46     R=' -R%f'%western_lon+'/%f'%eastern_lon+'/%f'%lower_lat+'/%f'%upper_lat
  47     I=' -I0.3333333/0.2'
  48     J=' -Jm0.2 '
  49     A=' -Ba5g5/a5g5NESW '
  50     C='color.tab'
  51
  52     lats=(upper_lat-indices((Y,X))[0,:,:].astype(float)*Dlat)
  53     lons=(indices((Y,X))[1,:,:].astype(float)*Dlon+western_lon)
  54
  55     filename='data.grd'
  56     write_grd(data,lats,lons,filename,I,R)
  57
  58
  59     os.system('gmtset PAPER_MEDIA A4 PLOT_DEGREE_FORMAT ddd:mm:ss')
  60     os.system('makecpt -Cjet -T0/5/1  -Z -D  > '+C)
  61     os.system('grdimage '+filename+R+J+A+' -C'+C+'   -K > '+outfile)
  62     os.system('pscoast '+R+J+A+' -N1 -W1/0/0/0 -G200/200/200 -Di -K -O >> '+outfile)
  63
  64     #Scale bar
  65     scl_tick='1/:mg/m\032:'
  66     print 'Add scale bar'
  67     os.system('psscale -D3.5/-0.6/2.0/0.1h -E -C'+C+' -B'+scl_tick+' -K -O >> '+outfile)
  68     os.system('echo "0.0 -0.03 14 0.0 0 0  '+title+'" | pstext -N -R0/1/0/1 -JX21/29  -O >> '+outfile)
  69     return
  70
  71
  72
  73 #TEST
  74 filename='testbild82x88.hdf'
  75 d=hdf_get(filename)
  76
  77 data=d['z']
  78 outfile='map.ps'
  79 title='Chlorophyll am Tag X'
  80 gmt_map(data,outfile,title)
  81 os.system('gv '+outfile)
GMT Karte

