|
Size: 4311
Comment:
|
Size: 4187
Comment:
|
| Deletions are marked like this. | Additions are marked like this. |
| Line 16: | Line 16: |
| SAR images are already being used for the operational oil-spill monitoring. These images are used for comprehensive statistical analyses that allow, e.g., an assessment of the mean oil pollution of dedicated coastal regions and its seasonal variability. Such analyses were recently done for Indonesian coastal waters. | . [[KFEW3O/IndoNACE|{{attachment:Sat_Env.jpg|IndoNACE|height="60"}}]] SAR images are already being used for the operational oil-spill monitoring. These images are used for comprehensive statistical analyses that allow, e.g., for an assessment of the mean oil pollution of dedicated coastal regions and its seasonal variability. Such analyses were recently done for Indonesian coastal waters. For more information click [[KFEW3O/IndoNACE|here]]. |
| Line 18: | Line 18: |
| . [[IndoNACE|{{attachment:Sat_Env.jpg|IndoNACE|height="60"}}]] To the wiki pages of the '''statistical analyses''' of oil pollution based on SAR imagery [[IndoNACE|this way]]. SAR images, along with data acquired by other sensors, can be used to detect submesoscale and mesoscale turbulent processes at the water surface and to identify their spatio-temporal variation. Collaborative studies have been performed together with colleagues from the University's Department of Informatics, from Moscow and Ufa, Russia, and from Liège, Belgium. . [[KFEW3O/SAREddies|{{attachment:Sat_S1A.jpg|KFEW3O/SAREddies|height="60"}}]] To the wiki pages of the analyses of '''submeso- and mesoscale phenomena''' using SAR data [[KFEW3O/SAREddies|this way]]. |
. [[KFEW3O/SAREddies|{{attachment:Sat_S1A.jpg|KFEW3O/SAREddies|height="60"}}]] SAR images, along with data acquired by other sensors, can be used to detect submesoscale and mesoscale turbulent processes at the water surface and to identify their spatio-temporal variation. Collaborative studies have been performed together with colleagues from the University's Department of Informatics, from Moscow and Ufa, Russia, and from Liège, Belgium. For more information click [[KFEW3O/SAREddies|here]]. |
KFEW³O at IfM
KFEW³O stands for Küsten-FErnerkundung und WechselWirkungen an der WasserOberfläche (Coastal Remote sensing and Air-Water Interactions). We perform systematic analyses of satellite imagery, particularly of synthetic aperture radar (SAR) imagery of coastal regions, of field campaigns involving measurements of the radar backscattering from the sea surface, and of lab experiments in the University's wind-wave tank.
Satellite Imagery
We are regularly analysing satellite images, particularly those acquired by synthetic aperture radar (SAR) sensors. These high-resolution active microwave sensors are used to derive oceanic processes and phenomena from sea surface roughness variations that manifest in spatial variations of the SAR image intensity. Below is a list of recent and actual studies based on systematic analyses of large numbers of SAR data.
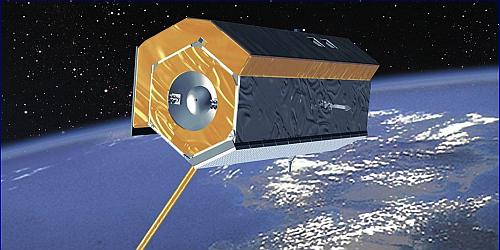 Sediments and habitats on exposed intertidal flats. Variations in the normalized radar cross section at different radar bands and polarizations can be used to gain information on the distribution of various sediments and on the location of habitats on dry-fallen sandbanks. For more information on our studies performed together with colleagues from Germany and China click here.
 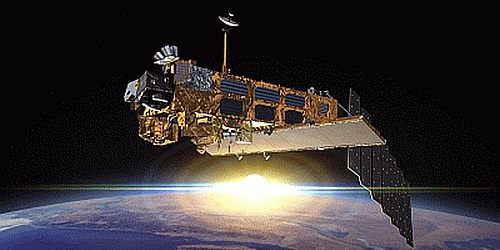 SAR images are already being used for the operational oil-spill monitoring. These images are used for comprehensive statistical analyses that allow, e.g., for an assessment of the mean oil pollution of dedicated coastal regions and its seasonal variability. Such analyses were recently done for Indonesian coastal waters. For more information click here.
 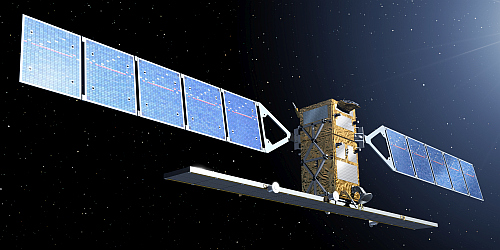 SAR images, along with data acquired by other sensors, can be used to detect submesoscale and mesoscale turbulent processes at the water surface and to identify their spatio-temporal variation. Collaborative studies have been performed together with colleagues from the University's Department of Informatics, from Moscow and Ufa, Russia, and from Liège, Belgium. For more information click here.
Wind-Wave Tank
The University's wind-wave tank was built in the early 1970s and is located at the Federal Institute of Waterways Engineering in Hamburg-Rissen. We have been performing measurements of wave damping by monomolecular surface films, of the radar backscattering from the water surface, and of exchange processes across the water-air interface. The wind-wave tank is also used for educational purposes such as practical courses and BSc-/MSc studies.
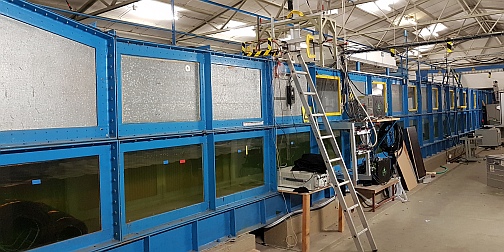 To the wind-wave tank's Wiki pages this way.
Scatterometer
Systematic measurements of the radar backscattering from the sea surface and their analyses contribute to a better understanding of backscattering mechanisms in general and to the development of methods to derive oceanic and atmospheric parameters from such measurements. Lab experiments deploying a scatterometer were performed from the 1980s, and in the 1990s field campaigns were performed in the German Bight of the North Sea, deploying a scatterometer from board a helicopter and from a radar tower, allowing measurements at 5 frequency bands and at 4 polarization combinations.
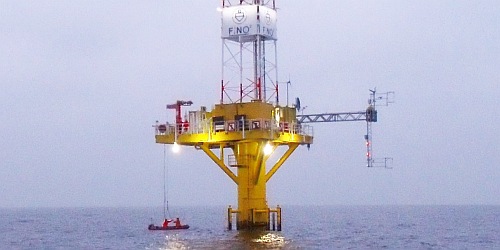 To the wiki pages of tower-based scatterometer measurements this way.
Miscellaneous, Internal Pages

 ...to the Internal FEW³O pages this way.
