|
Size: 2296
Comment:
|
Size: 2272
Comment:
|
| Deletions are marked like this. | Additions are marked like this. |
| Line 41: | Line 41: |
| == Using Google Earth for visualization == | == Google Earth == |
Contents
Visualisation
Basemap
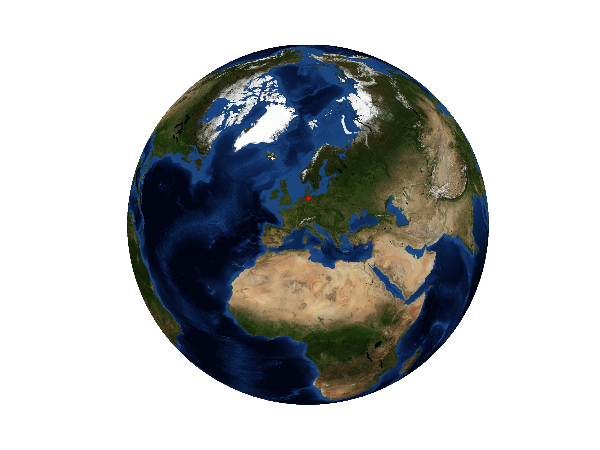
The matplotlib basemap toolkit is a library for plotting 2D data on maps in Python.

Set the correct path for using Basemap
module load R/2.7.0
module load Python/2.6.2
GMT
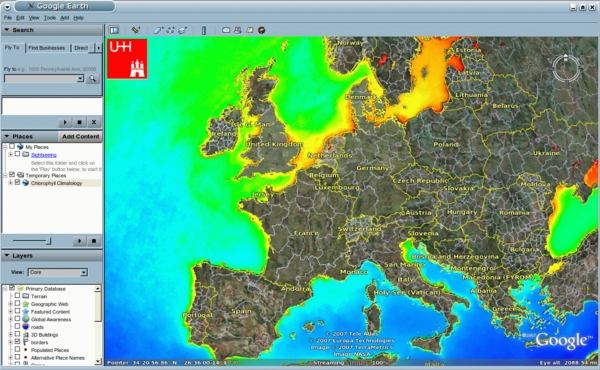
Google Earth

Documentation:
http://code.google.com/apis/kml/documentation/
Chlorophyll data:
http://oceancolor.gsfc.nasa.gov/cgi/climatologies.pl
Download png and make black transparent
convert -transparent black A20020012007273.L3m_CU_CHLO_4.png A20020012007273.L3m_CU_CHLO_4_trans.png
Create .kml file
<?xml version="1.0"?>
<kml xmlns="http://earth.google.com/kml/2.1"><Document><name>Chlorophyll Climatology</name>
  <Folder>
<Snippet maxLines="0"/>
<name>MODIS</name>
<ScreenOverlay>
  <name>UHH Logo</name>
  <color>ffffffff</color>
  <visibility>1</visibility>
  <Icon>
    <href>http://www.ifm.uni-hamburg.de/logo_uhh_neu.gif</href>
  </Icon>
      <overlayXY x="0" y="1" xunits="fraction" yunits="fraction"/>
      <screenXY x="5" y="5" xunits="pixels" yunits="insetPixels"/>
      <size x="90" y="90" xunits="pixel" yunits="pixel"/>
</ScreenOverlay>
<LookAt>
        <longitude>8</longitude>
        <latitude>53</latitude>
         <altitude>2000000</altitude>
  <heading>0</heading>
</LookAt>
<Folder> <Snippet maxLines="0"/>
<name>Chlorophyll</name><GroundOverlay> <name>2002-2007</name>
<visibility>1</visibility><color>ffffffff</color>
<Icon><href>A20020012007273.L3m_CU_CHLO_4_trans.png</href></Icon>
<LatLonBox><north>90</north><south>-90</south><east>180</east><west>-180</west></LatLonBox>
</GroundOverlay></Folder></Folder></Document></kml>