Visualisation
Python does not rely on one standard library for plotting and visualization, you have the choice to from several alternatives:
matplotlib is becoming a quasi standard for plotting within the numpy/scipy/ipython environment and easy to use.
PyNGL and PyNIO provide interfaces to the functionality existing in the NCAR Command Language (NCL).
Mayavi Project - 3D Scientific Data Visualization and Plotting
Interaction with other (non-Python) tools, e.g. The Generic Mapping Tools, Google Earth
2 D Plots with Pylab

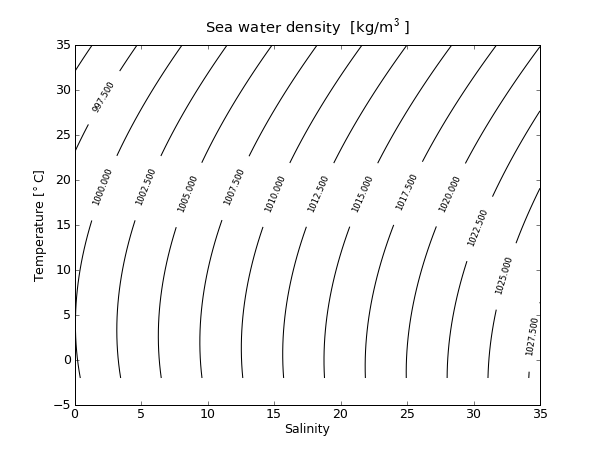
   1 from pylab import *
   2 # The seawater module is installed only for Python2.6.2:
   3 # module load Python/2.6.2
   4 import seawater
   5
   6 S=linspace(0,35)
   7 T=linspace(-2,35.0)
   8
   9 rho=zeros((S.size,T.size))
  10
  11 for i,t in enumerate(T):
  12     rho[i,:]=seawater.dens(S,t)
  13
  14 figure()
  15 CS = contour(S,T,rho,15,colors='k')
  16 clabel(CS, fontsize=8, inline=1)
  17 ylabel('Temperature [$^\circ$C]')
  18 xlabel('Salinity')
  19 title('Sea water density  [kg/m$^3$]')
  20 show()
  21 savefig('density.png',dpi=75)
Basemap
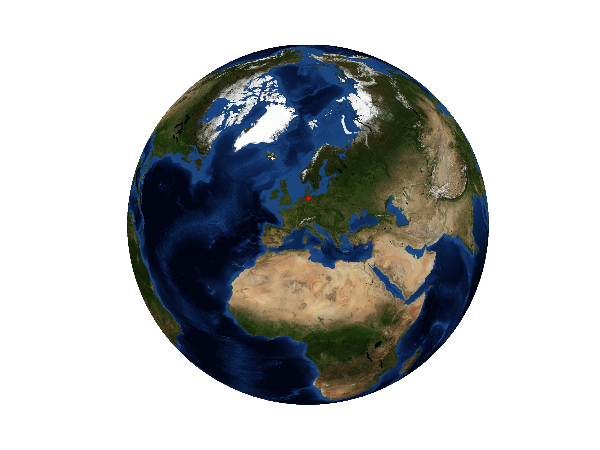
The matplotlib basemap toolkit is a library for plotting 2D data on maps in Python.

Don't forget to set the correct path for using Basemap on ZMAW systems
module load Python
GMT

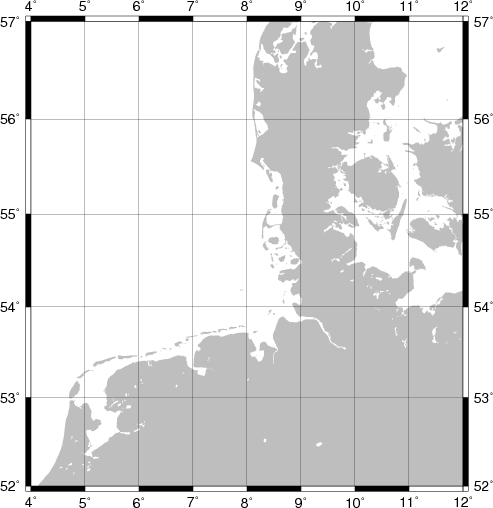
GMT is an open source collection of ~60 tools for manipulating geographic and Cartesian data sets (including filtering, trend fitting, gridding, projecting, etc.) and producing publication quality scientific plots.
In particular useful are the gridding routines which can be used for irregular sampled oceanographic as well as for satellite data.
GMT can be easily applied together with Python using the os module.
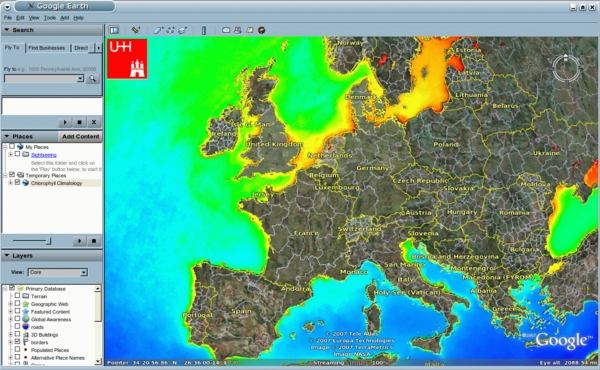
Google Earth

Documentation:
http://code.google.com/apis/kml/documentation/
Chlorophyll data:
http://oceancolor.gsfc.nasa.gov/cgi/climatologies.pl
Download png and make black transparent
convert -transparent black A20020012007273.L3m_CU_CHLO_4.png A20020012007273.L3m_CU_CHLO_4_trans.png
Create .kml file
<?xml version="1.0"?>
<kml xmlns="http://earth.google.com/kml/2.1"><Document><name>Chlorophyll Climatology</name>
  <Folder>
<Snippet maxLines="0"/>
<name>MODIS</name>
<ScreenOverlay>
  <name>UHH Logo</name>
  <color>ffffffff</color>
  <visibility>1</visibility>
  <Icon>
    <href>http://www.ifm.uni-hamburg.de/logo_uhh_neu.gif</href>
  </Icon>
      <overlayXY x="0" y="1" xunits="fraction" yunits="fraction"/>
      <screenXY x="5" y="5" xunits="pixels" yunits="insetPixels"/>
      <size x="90" y="90" xunits="pixel" yunits="pixel"/>
</ScreenOverlay>
<LookAt>
        <longitude>8</longitude>
        <latitude>53</latitude>
         <altitude>2000000</altitude>
  <heading>0</heading>
</LookAt>
<Folder> <Snippet maxLines="0"/>
<name>Chlorophyll</name><GroundOverlay> <name>2002-2007</name>
<visibility>1</visibility><color>ffffffff</color>
<Icon><href>A20020012007273.L3m_CU_CHLO_4_trans.png</href></Icon>
<LatLonBox><north>90</north><south>-90</south><east>180</east><west>-180</west></LatLonBox>
</GroundOverlay></Folder></Folder></Document></kml>
Grads
http://opengrads.org/wiki/index.php?title=PyGrADS_Interactive_Shell
Exercise
Add to the above Basemap the air temperature from NCEP reanalyis as isolines:
