|
⇤ ← Revision 1 as of 2014-04-02 16:17:01
Size: 2412
Comment:
|
← Revision 2 as of 2014-09-13 14:56:24 ⇥
Size: 2460
Comment:
|
| Deletions are marked like this. | Additions are marked like this. |
| Line 1: | Line 1: |
| ## page was renamed from TO/pyOM/ENSO Response |
Introduction
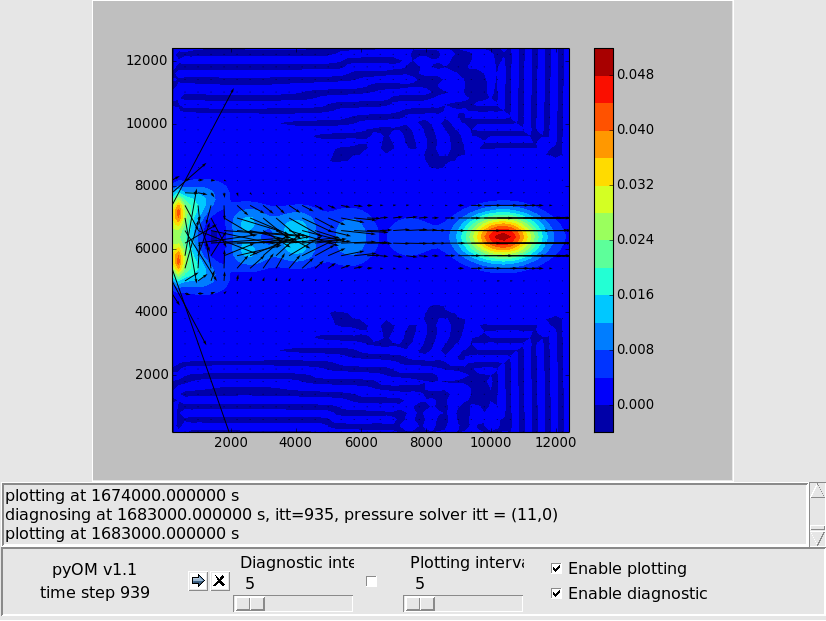
This model is to simulate the El Niño–Southern Oscillation effect.
Example in Python GUI

Reference
Olbers, Dirk, Willebrand, Jürgen, Eden, Carsten. Ocean Dynamics. Springer, 2012. Print
Source Code
   1 import sys; sys.path.append('../py_src')
   2 from pyOM_gui import pyOM_gui as pyOM
   3 from numpy import *
   4
   5 BETA=2e-11
   6
   7 class enso1(pyOM):
   8    """ Enso response
   9    """
  10    def set_parameter(self):
  11      """set main parameter
  12      """
  13      M=self.fortran.pyom_module
  14      M.nx    = 64
  15      M.nz    = 3
  16      M.ny    = 64
  17      M.dx    = 200e3
  18      M.dz = (500e3**2*BETA) **2 /9.81
  19      M.dt    = 3600.0 /2.
  20      M.eps2d_sor = 1e-22
  21      M.enable_hydrostatic          = 1
  22      M.enable_cyclic_x             = 0
  23      M.enable_quicker_advection    = 1
  24      M.enable_quicker_mom_advection= 1
  25      M.enable_free_surface         = 1
  26      return
  27
  28 def set_coriolis(self):
  29      """ vertical and horizontal Coriolis parameter on yt grid
  30          routine is called after initialization of grid
  31      """
  32      M=self.fortran.pyom_module
  33      f0=-M.ny*M.dx/2.0*BETA   # equatorial beta plane
  34      M.coriolis_t[:]   =  f0+BETA*M.yt[:]
  35      M.coriolis_hor[:] =  0.
  36      return
  37
  38 def initial_conditions(self):
  39      """ setup all initial conditions
  40      """
  41      M=self.fortran.pyom_module
  42      cn =  (M.dz*9.81)**0.5
  43      hn=cn**2/9.81
  44      Re = (cn /BETA)**0.5
  45      y0=M.ny*M.dx*0.5
  46      g=9.81
  47      A = .1
  48      for i in range(M.nx):
  49        for j in range(M.ny):
  50          M.eta[i,j,:]=0.1*exp( -(M.xt[i]-y0*0.3)**2/(2*Re)**2 \
  51                                -(M.yt[j]-y0)**2/(2*Re)**2 )
  52      return
  53
  54 def make_plot(self):
  55      """ make a plot using methods of self.figure
  56      """
  57      if hasattr(self,'figure'):
  58        M=self.fortran.pyom_module         # fortran module with model variables
  59        x=M.xt[1:-1]/1e3
  60        y=M.yt[1:-1]/1e3
  61
  62 self.figure.clf()
  63        ax=self.figure.add_subplot(111)
  64        a=M.eta[1:-1,1:-1,M.tau-1]
  65        co=ax.contourf(x,y,a.transpose(),15)
  66        ax.axis('tight')
  67
  68        a=M.u[1:-1:2,1:-1:2,1,M.tau-1]
  69        b=M.v[1:-1:2,1:-1:2,1,M.tau-1]
  70        ax.quiver(x[::2],y[::2],a.transpose(),b.transpose() )
  71        self.figure.colorbar(co)
  72      return
  73
  74 if __name__ == "__main__": enso1(snapint  = 5).mainloop()
