Experiments With Monomolecular Surface Films
Investigations on Wave Damping and Radar Backscattering
We performed measurements of the damping of small gravity and gravity-capillary water surface waves covered with monomolecular organic films of different viscoelastic properties. The wind-speed dependence of the radar cross sections for X and Ka band was measured with upwind looking microwave antennas. We show that Marangoni damping theory, which describes the damping of water surface waves by viscoelastic surface films, is not the only damping mechanism in wind wave tank experiments where the wind sea is not fully developed. The other source terms of the action balance equation, i.e., the energy input into the water waves from the wind, the nonlinear wave-wave interaction, and the dissipation by wave breaking, are affected differently by the various substances. It is hypothesized that this difference is caused by the different intermolecular interactions of the film molecules causing different viscoelastic properties. Polarization ratios (i.e., the ratios of the radar backscatter at vertical and horizontal polarization) higher than those predicted by simple Bragg scattering theory for X band at low wind speeds and different incidence angles are explained within a (three-scale) composite-surface model. The dependence of the polarization ratio on the coverage of the water surface with a slick is explained qualitatively by means of the composite-surface model. Our measurements prove that wind wave tank measurements in the presence of monomolecular surface films are useful for the verification of theories concerning radar backscattering, wave damping, and wind-wave and wave-wave interactions.
References:
Gade, M., W. Alpers, H. Hühnerfuss, and P.A. Lange, 1998: Wind-wave tank measurements of wave damping and radar cross sections in the presence of monomolecular surface films, J. Geophys. Res., 103, 3167-3178.
Wave Damping Measurements
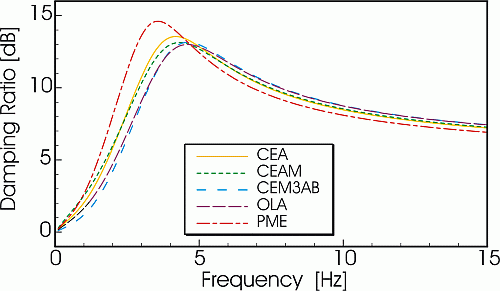
Theoretical damping curves for the deployed substances, according to Marangoni damping theory.
The damping ratio, y(f), is the ratio of the viscous damping coefficients at slick-covered and slick-free water surfaces:


Wave height spectra for slick-free and slick-covered water surfaces; solid lines: 8 m/s wind speed, slick-covered water surfaces; dashed-dotted line: 8 m/s wind speed, slick-free water surface; dotted line: 5 m/s wind speed, slick-free water surface, i.e., the same friction velocity, u* , as in the slick-covered cases.
The table below shows the rheological parameters for the deployed substances, i.e., the absolute value E and phase theta, of the complex dilational modulus, the frequency of maximum damping ratio (f_M, "Maragoni frequency"), and the maximum damping ratio, y_max.

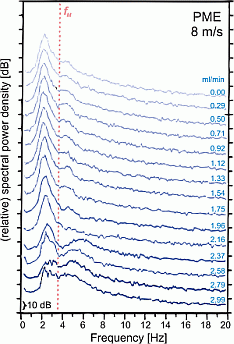
In order to simulate different states of the development of biogenic slicks on the ocean surface, we varied the dropping rate, i.e., the amount of dissolved substance that was deployed (lower left figure). The change of the (relative) wave height spectra is depicted in the left Panel as a function of increasing dropping rate. The measurements were carried out at a wind speed of 8 m/s when PME was deployed at 5.5 m fetch. The vertical dotted line indicates the frequency of the maximum damping ratio (Marangoni frequency). With increasing dropping rate the spectral peak frequency increases, and the dip around the Marangoni frequency becomes more pronounced. At a dropping rate of 2.79 mL/min (corresponding to 0.2 mmol/min of PME) the wind waves almost vanish, as can be inferred from the decrease in the total spectral power. Further increase in the dropping rate does not cause significant changes in the wave height spectra due to the saturation of the water surface with the deployed substance.

In two measurement series the substances were deployed at two different points, i.e., directly at the wind entrance (Point 1) and at a fetch of 5.5 m (Point 2). The reference wind speed was increased from 2 m/s up to 10 m/s in steps of 2 m/s. The respective wind profiles recorded at 15.5 m fetch are shown in the upper right figure. The red crosses, solid black diamonds, and blue circles depict the wind speeds measured over a slick-free water surface, a water surface covered with CEM3AB deployed at point 1, and a water surface covered with CEM3AB deployed at point 2, respectively. Note that the slick coverage caused higher wind speeds above the water surface (i.e., steep profiles). At 10 m/s the CEM3AB slick deployed at point 1 was already disrupted by the strong wind action.
Radar Cross Sections (RCS)
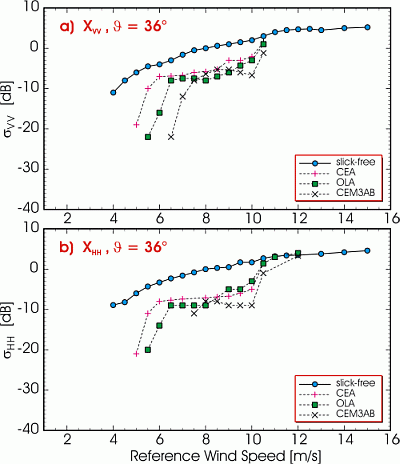
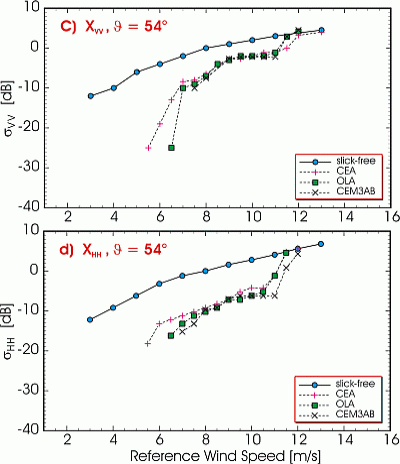
The presence of monomolecular films at the air/water interface leads to a reduction of the spectral power density of the Bragg waves and therefore to a reduction of the mean backscattered radar power. This reduction has been measured at X band at incidence angles of 36° (Panels a) and b)) and 54° (Panels c) and d)) and at Ka band at 53° (Panel e)). The corresonding intrinsic frequencies of the Bragg waves are 9.3 Hz (X band, 36°), 12.2 Hz (X band, 54°), and 61.8 Hz (Ka band, 53°). According to Marangoni damping theory (see the theoretical curves above), the longer X band Bragg waves at 36° incidence angle are more affected by the different damping behavior of the deployed substances than the shorter ones at 54° incidence angle. As a consequence, the decrease in the RCS is more pronounced at 36° incidence angle and the measured curves exhibit a stronger decrease (at wind speeds of 7–9 m/s). However, Marangoni damping theory cannot explain the strong RCS reduction at Ka band.
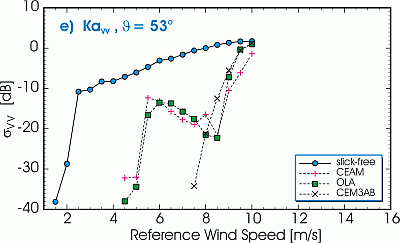
Complementing wind-wave tank measurements give rise to the explanation that two different kinds of ripple waves are responsible for the radar backscattering, namely, freely propagating waves and waves bound to the longer decimeter waves. If these two kinds of waves are damped in a different way (via their different generation mechanisms), the result should be a change of the measured damping behavior, which was observed in our measurements.

The backscattered radar power was measured as a function of the dropping rate. The results for PME and OLA at different wind speeds are depicted in the above figures. Obviously, the backscattered radar power at low wind speeds is more sensitive to the dropping rate when OLA is deployed (right panel). A low amount of OLA causes a strong damping at 6–7 m/s wind speed, while at higher wind speeds the dependency for both substances is similar (the absolute values of the dropping rate cannot be compared because of the different chemical structure of the monomolecular films).
X-Band Polarization Ratios
The wind dependence of the polarization ratio, sVV /sHH, at incidence angles of 36° and 54° is depicted for slick-free and slick-covered water surfaces in the figures below, where the solid horizontal lines denote the theoretical values according to simple Bragg scattering theory (SBS), and the dashed horizontal lines denote the same values according to a composite surface model [CSM].
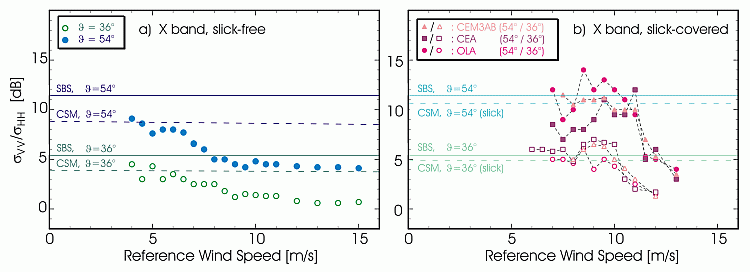
In the slick-free case (Panel a)) and for low to moderate wind speeds (up to 6 m/s) the measured ratios agree with those calculated by the composite surface model. However, at higher wind speeds (Uref > 6 m/s) they decrease, a finding that can be explained by the increased dominance of wedges and spilling breakers at high wind speed, which in turn causes an increased backscatter at HH polarization. Therefore, the polarization ratio decreases, which is in agreement with the experimental results. The abrupt strong decrease in the polarization ratios at high wind speeds is due to the dispersing of the slicks; therefore, the values become comparable to those measured on a slick-free water surface. Again, at high wind speeds (above 11 m/s), backscattering by wedges and spilling breakers, which was prevented by the slicks at low wind speeds, leads to low values of the polarization ratio.

 .. back to the Wind-Wave Tank page...
 .. or to the KFEW3O page ...
