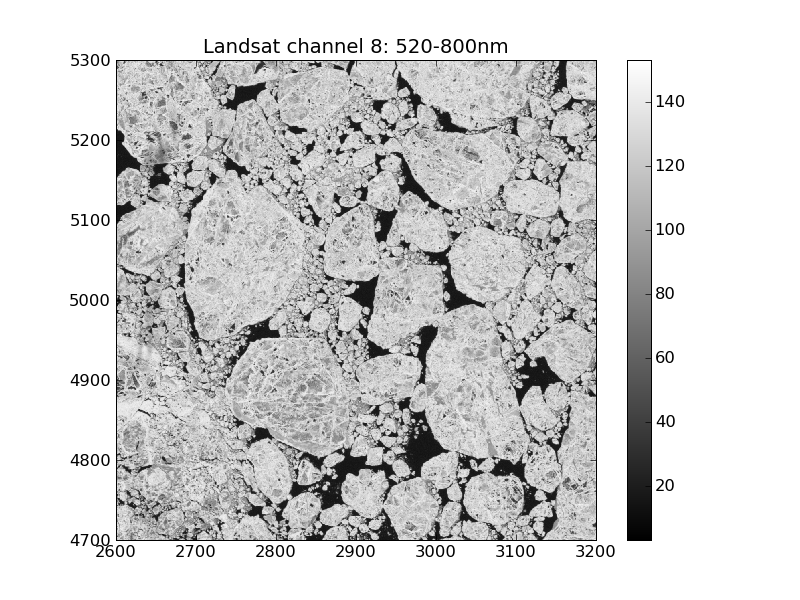
Image statistics
The image is characterised by a probability density function (PDF). The PDF f describes the probability of the occurrence of a discrete grey level q in the range of grey levels Q.
latex error! exitcode was 2 (signal 0), transscript follows:
Example

The following code calculates the PDF pdf for a byte image in the intervall [0,255]
latex error! exitcode was 2 (signal 0), transscript follows:
