Image statistics
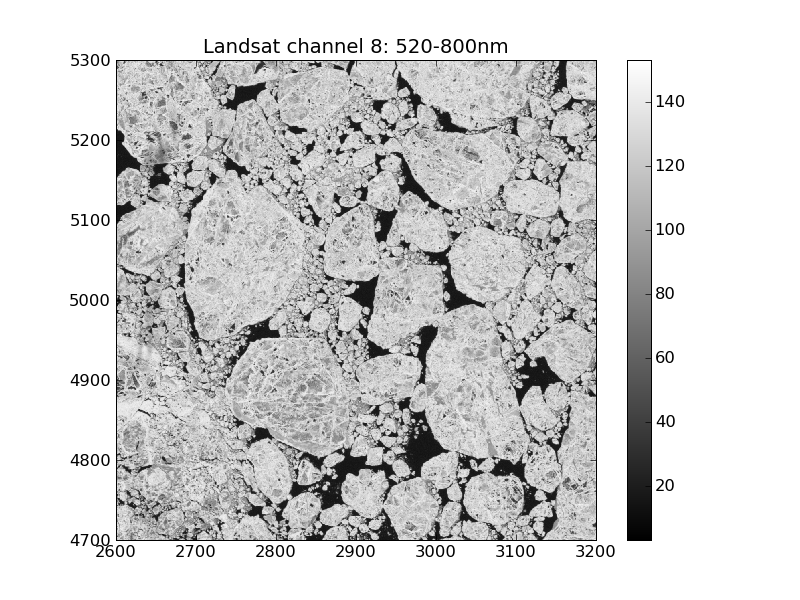
The measurements that form an image show statistical fluctuations. The image is characterised by a probability density function (PDF). The PDF f describes the probability of the occurrence of a discrete grey level q in the range of grey levels Q.
latex error! exitcode was 2 (signal 0), transscript follows:
Probability density functions and histograms
The PDF of an image can be calculated and displayed using the pylab.hist function or it can be calculated using the scipy.histogram function.

