|
⇤ ← Revision 1 as of 2008-12-08 12:17:36
Size: 719
Comment:
|
Size: 719
Comment:
|
| Deletions are marked like this. | Additions are marked like this. |
| Line 7: | Line 7: |
| = Random variables = | = Image statistics = |
| Line 20: | Line 20: |
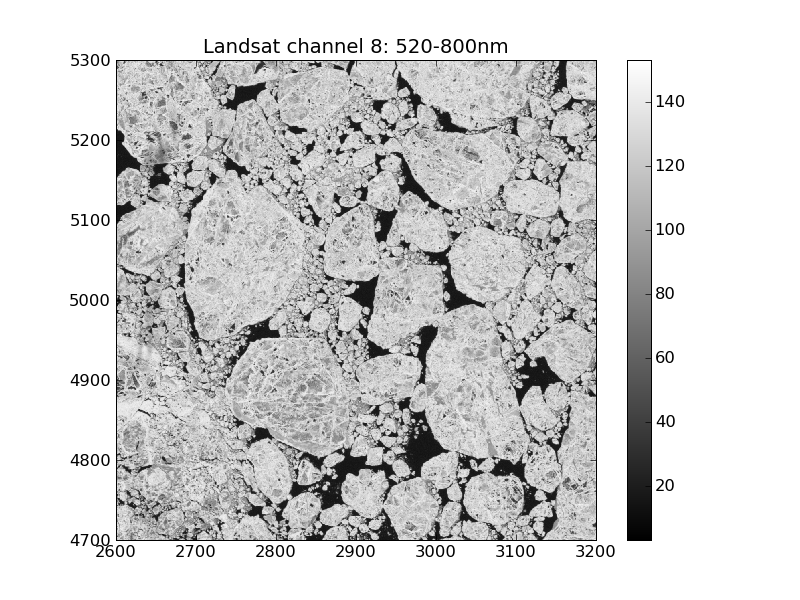
| [[attachment:landsat_b80.png]] | {{attachment:landsat_b80.png}} |
Image statistics
The measurements that form an image show statistical fluctuations. The image is characterised by a probability density function (PDF). The PDF f describes the probability of the occurrence of a discrete grey level q in the range of grey levels Q.
latex error! exitcode was 2 (signal 0), transscript follows:
Probability density functions and histograms
The PDF of an image can be calculated and displayed using the pylab.hist function or it can be calculated using the scipy.histogram function.

