|
Size: 200
Comment:
|
Size: 5649
Comment:
|
| Deletions are marked like this. | Additions are marked like this. |
| Line 2: | Line 2: |
== Code zur Kartendarstellung == {{{#!Python import Image from pylab import * from mpl_toolkits.basemap import Basemap import numpy as np def load_img(filename): im=Image.open(filename) return resize(fromstring(im.tostring(),uint8),(im.size[1],im.size[0],3)) import scipy.ndimage as nd # define coordinates of profile lat_glatt=[77.0,78.0,79.0] lon_glatt_start,lon_glatt_stop=2.0,10.0 filename='AERONET_Hornsund.2009072.aqua.250m.jpg' a=load_img(filename) a=nd.zoom(a[:,:,0],0.2) north=80.2363 south=73.7612 east=40.4156 west=-9.3026 filename='AERONET_Hornsund.2009072.aqua.250m.jgw' cds=array(open(filename).read().split('\n')[:-1]).astype(float) [yn,xn]=shape(a) # make grid x=linspace(west,east,xn) y=linspace(north,south,yn) [lons,lats] = meshgrid(x,y) start=find(x>lon_glatt_start)[0] stop=find(x>lon_glatt_stop)[0] line=[] for i in lat_glatt: line.append(find(y<i)[0]) figure(2) m=Basemap(projection='merc',llcrnrlat=74,urcrnrlat=80,llcrnrlon=-9,urcrnrlon=20,resolution='h') xm,ym=m(lons,lats) xi=linspace(m.llcrnrx,m.urcrnrx,xn) # define the new grid yi=linspace(m.llcrnry,m.urcrnry,yn) modis_img_nmpg=griddata(xm.flatten(),ym.flatten(),a.flatten(),xi,yi) m.imshow(modis_img_nmpg,cm.bone, interpolation='bilinear',aspect='auto') m.drawcoastlines() m.fillcontinents(color='gray',lake_color='aqua') m.drawmapboundary(fill_color='aqua') m.drawmeridians(np.arange(0,360,5),labels=[1,0,0,1]) m.drawparallels(np.arange(-90,90,2),labels=[0,1,0,1]) cls=('ryg') for k,i in enumerate(line): x1,y1=m(x[start],y[i]) x2,y2=m(x[stop],y[i]) m.plot([x1,x2],[y1,y2],'-'+cls[k],linewidth=3) for j in range(182,191): x,y=m(j-180.,77) m.plot(x,y,'b.',markersize=12) x,y=m(j-180.,78) m.plot(x,y,'b.',markersize=12) x,y=m(j-180.,79) m.plot(x,y,'b.',markersize=12) show() savefig('modis_test.png') }}} {{attachment:modis_test.png}} == Längenspektren über die Profile == {{{#!python import Image from pylab import * from mpl_toolkits.basemap import Basemap import numpy as np from scipy import ndimage def load_img(filename): im=Image.open(filename) return resize(fromstring(im.tostring(),uint8),(im.size[1],im.size[0],3)) def mitteln(bild,ref_y,ref_x_start,ref_x_stop,h): y_inds=range(ref_y-h,ref_y+h) tempo=zeros([len(y_inds),ref_x_stop-ref_x_start]) k=0 for i in y_inds: tempo[k,:]=a[i,ref_x_start:ref_x_stop,0] k=k+1 out=mean(tempo,0) return out # define coordinates of profile lat_glatt=79.0 lon_glatt_start,lon_glatt_stop=2.0,10.0 # load data filename='AERONET_Hornsund.2009072.aqua.250m.jpg' a=load_img(filename) north=80.2363 south=73.7612 east=40.4156 west=-9.3026 [yn,xn,dum]=shape(a) # make grid x=linspace(west,east,xn) y=linspace(north,south,yn) [lons,lats] = meshgrid(x,y) start=find(x>lon_glatt_start)[0] stop=find(x>lon_glatt_stop)[0] line=find(y<lat_glatt)[0] test=mitteln(a,line,start,stop,30) test=ndimage.gaussian_filter1d(test,3) # power spectrum figure(1) [pxx,freq]=psd(test,NFFT=512,Fs=1,Fc=0,detrend=mlab.detrend_linear,window=mlab.window_hanning, noverlap=0) # plot spectrum selber figure(2) freq=0.25/freq plot(freq[1:],pxx[1:],'g-') xlim((0,40)) xlabel('Zelldurchmesser [km]') ylabel('spektrale Dichte') # plot schnitt figure(3) plot(test,'r-') show() }}} ---- /!\ '''Edit conflict - other version:''' ---- ---- /!\ '''Edit conflict - your version:''' ---- === 77°N === {{attachment:spek_77.png}} === 78°N === {{attachment:spek_78.png}} === 79°N === {{attachment:spek_79.png}} ---- /!\ '''End of edit conflict''' ---- |
|
| Line 5: | Line 191: |
| {{{#!python #!/bin/tcsh from pyhdf import SD from pylab import * from mpl_toolkits.basemap import Basemap fid=SD.SD('AIRS.2003.03.30.L3.RetStd001.v5.0.14.0.G07215021620.hdf') T=fid.select('Temperature_A') Temp=T.get() #Drucklevel Lv=[1000.0,925.0,850.0,700.0,600.0,500.0,400.0,300.0,250.0,200.0,150.0,100.0, 70.0, 50.0,30.0, 20.0, 15.0, 10.0, 7.0,5.0, 3.0,2.0,1.5,1.0] # Temperaturprofile figure(1) plot(Temp[:,13,187],Lv) ylim((1000.0,1.0)) xlim((200.0,280.0)) xlabel('T in Kelvin') ylabel('p in hPa') title('used profiles lon=77') show() savefig('Soundings1.png',dpi=75) figure(2) plot(Temp[:,12,184],Lv) ylim((1000.0,1.0)) xlim((200.0,280.)) xlabel('T in Kelvin') ylabel('p in hPa') title('used profiles lon=78') show() savefig('Soundings2.png',dpi=75) figure(3) plot(Temp[:,11,187],Lv) ylim((1000.0,1.0)) xlim((200.0,280.0)) xlabel('T in Kelvin') ylabel('p in hPa') title('used profiles lon=79') show() savefig('Soundings3.png',dpi=75) }}} |
|
| Line 7: | Line 237: |
== Grenschichthöhe == |
{{attachment:Soundings1.png}} {{attachment:Soundings2.png}} {{attachment:Soundings3.png}} == Grenzschichthöhe == Grenzschichtdicke in Meter umrechnen mit barometrischer Höhenformel: {{{#!latex $\Delta z = \frac{R_L T}{g}ln\left(\frac{p}{p_s}\right)$}}} R=287,1J/kgK Annahme: T=const. (dadurch wird Grenzschichtdicke unterschätzt) p=Druckniveau der Wolkenobergrenze ps=Bodendruck aus Karte Werte: || Breite || Dicke in hPa || Dicke in km || || 77 || 165 - 315 || 1,2 - 2,6 || || 78 || 90 - 165 || 0,6 - 1,2 || || 79 || 90 - 165 || 0,6 - 1,2 || genauere Bestimmung ist aufgrund der groben Auflösung der Drucklevel nicht möglich: Fehler in Größenordnung 1km |
Zusammenfassung Konvektionszellen
Code zur Kartendarstellung
   1 import Image
   2 from pylab import *
   3 from mpl_toolkits.basemap import Basemap
   4 import numpy as np
   5
   6 def load_img(filename):
   7     im=Image.open(filename)
   8     return resize(fromstring(im.tostring(),uint8),(im.size[1],im.size[0],3))
   9
  10 import scipy.ndimage as nd
  11 # define coordinates of profile
  12 lat_glatt=[77.0,78.0,79.0]
  13 lon_glatt_start,lon_glatt_stop=2.0,10.0
  14
  15
  16
  17 filename='AERONET_Hornsund.2009072.aqua.250m.jpg'
  18
  19
  20 a=load_img(filename)
  21
  22 a=nd.zoom(a[:,:,0],0.2)
  23
  24 north=80.2363
  25 south=73.7612
  26 east=40.4156
  27 west=-9.3026
  28
  29 filename='AERONET_Hornsund.2009072.aqua.250m.jgw'
  30 cds=array(open(filename).read().split('\n')[:-1]).astype(float)
  31
  32
  33
  34 [yn,xn]=shape(a)
  35
  36 # make grid
  37 x=linspace(west,east,xn)
  38 y=linspace(north,south,yn)
  39
  40 [lons,lats] = meshgrid(x,y)
  41
  42 start=find(x>lon_glatt_start)[0]
  43 stop=find(x>lon_glatt_stop)[0]
  44
  45 line=[]
  46 for i in lat_glatt:
  47     line.append(find(y<i)[0])
  48
  49 figure(2)
  50
  51 m=Basemap(projection='merc',llcrnrlat=74,urcrnrlat=80,llcrnrlon=-9,urcrnrlon=20,resolution='h')
  52
  53 xm,ym=m(lons,lats)
  54
  55 xi=linspace(m.llcrnrx,m.urcrnrx,xn) # define the new grid
  56 yi=linspace(m.llcrnry,m.urcrnry,yn)
  57 modis_img_nmpg=griddata(xm.flatten(),ym.flatten(),a.flatten(),xi,yi)
  58
  59
  60 m.imshow(modis_img_nmpg,cm.bone, interpolation='bilinear',aspect='auto')
  61 m.drawcoastlines()
  62 m.fillcontinents(color='gray',lake_color='aqua')
  63 m.drawmapboundary(fill_color='aqua')
  64
  65 m.drawmeridians(np.arange(0,360,5),labels=[1,0,0,1])
  66 m.drawparallels(np.arange(-90,90,2),labels=[0,1,0,1])
  67
  68 cls=('ryg')
  69 for k,i in enumerate(line):
  70     x1,y1=m(x[start],y[i])
  71     x2,y2=m(x[stop],y[i])
  72     m.plot([x1,x2],[y1,y2],'-'+cls[k],linewidth=3)
  73
  74
  75
  76 for j in range(182,191):
  77     x,y=m(j-180.,77)
  78     m.plot(x,y,'b.',markersize=12)
  79     x,y=m(j-180.,78)
  80     m.plot(x,y,'b.',markersize=12)
  81     x,y=m(j-180.,79)
  82     m.plot(x,y,'b.',markersize=12)
  83
  84 show()
  85 savefig('modis_test.png')
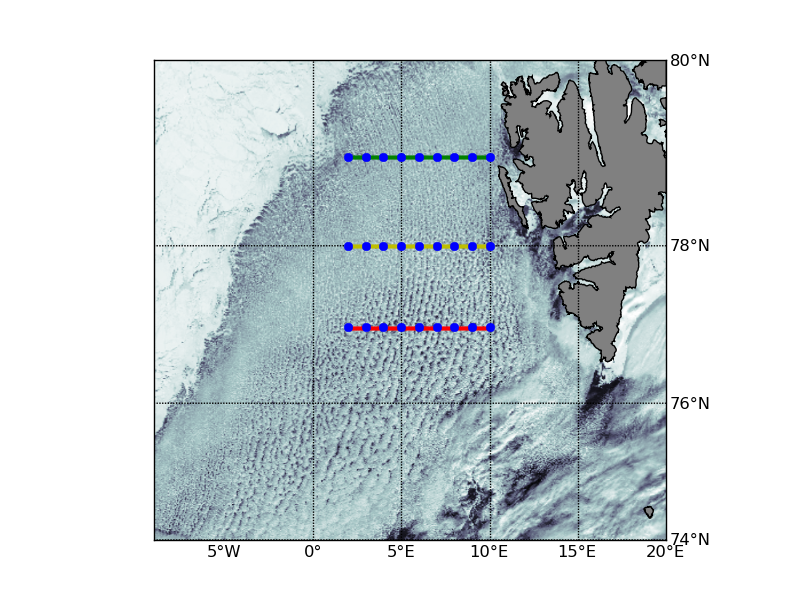
Längenspektren über die Profile
   1 import Image
   2 from pylab import *
   3 from mpl_toolkits.basemap import Basemap
   4 import numpy as np
   5 from scipy import ndimage
   6
   7 def load_img(filename):
   8     im=Image.open(filename)
   9     return resize(fromstring(im.tostring(),uint8),(im.size[1],im.size[0],3))
  10
  11 def mitteln(bild,ref_y,ref_x_start,ref_x_stop,h):
  12     y_inds=range(ref_y-h,ref_y+h)
  13     tempo=zeros([len(y_inds),ref_x_stop-ref_x_start])
  14     k=0
  15     for i in y_inds:
  16         tempo[k,:]=a[i,ref_x_start:ref_x_stop,0]
  17         k=k+1
  18
  19     out=mean(tempo,0)
  20     return out
  21
  22 # define coordinates of profile
  23 lat_glatt=79.0
  24 lon_glatt_start,lon_glatt_stop=2.0,10.0
  25
  26
  27 # load data
  28 filename='AERONET_Hornsund.2009072.aqua.250m.jpg'
  29
  30 a=load_img(filename)
  31
  32
  33 north=80.2363
  34 south=73.7612
  35 east=40.4156
  36 west=-9.3026
  37
  38 [yn,xn,dum]=shape(a)
  39
  40 # make grid
  41 x=linspace(west,east,xn)
  42 y=linspace(north,south,yn)
  43
  44 [lons,lats] = meshgrid(x,y)
  45
  46 start=find(x>lon_glatt_start)[0]
  47 stop=find(x>lon_glatt_stop)[0]
  48 line=find(y<lat_glatt)[0]
  49
  50 test=mitteln(a,line,start,stop,30)
  51 test=ndimage.gaussian_filter1d(test,3)
  52
  53 # power spectrum
  54 figure(1)
  55 [pxx,freq]=psd(test,NFFT=512,Fs=1,Fc=0,detrend=mlab.detrend_linear,window=mlab.window_hanning, noverlap=0)
  56
  57 # plot spectrum selber
  58 figure(2)
  59 freq=0.25/freq
  60 plot(freq[1:],pxx[1:],'g-')
  61 xlim((0,40))
  62 xlabel('Zelldurchmesser [km]')
  63 ylabel('spektrale Dichte')
  64
  65 # plot schnitt
  66 figure(3)
  67 plot(test,'r-')
  68
  69 show()
![]() Edit conflict - other version:
Edit conflict - other version:
![]() Edit conflict - your version:
Edit conflict - your version:
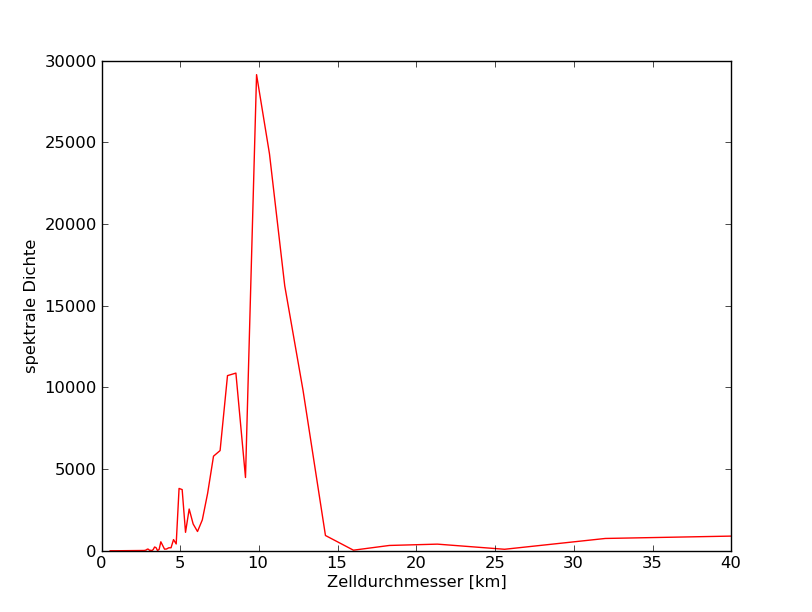
77°N
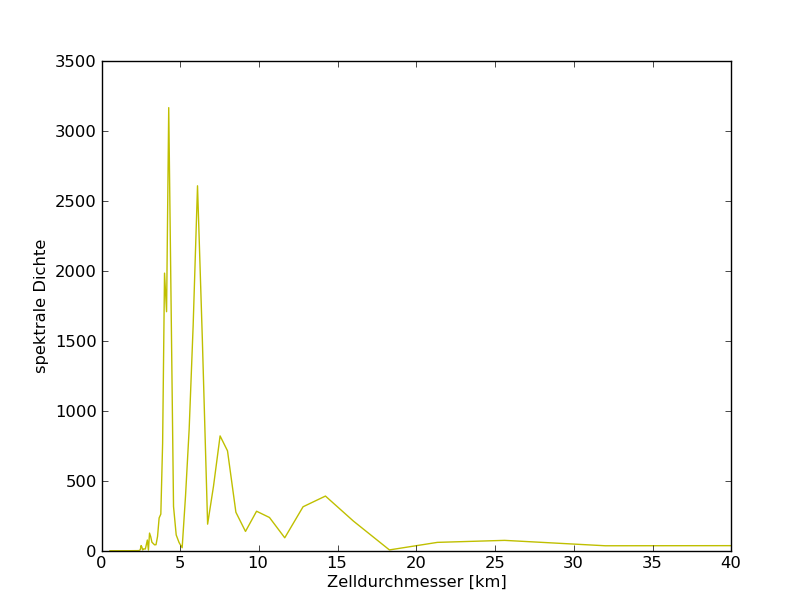
78°N
79°N
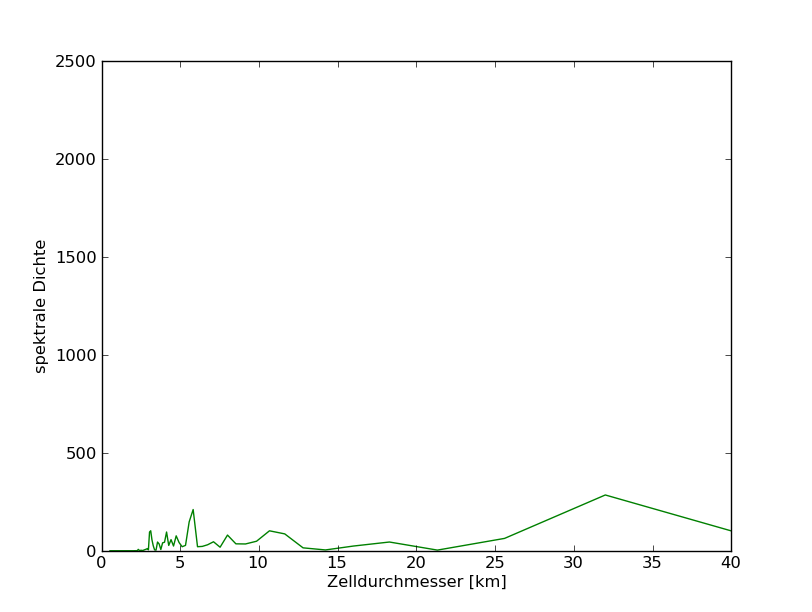
![]() End of edit conflict
End of edit conflict
Zusammenfassung Grenzschicht
Programmcode
   1 #!/bin/tcsh
   2
   3 from pyhdf import SD
   4 from pylab import *
   5 from mpl_toolkits.basemap import Basemap
   6
   7 fid=SD.SD('AIRS.2003.03.30.L3.RetStd001.v5.0.14.0.G07215021620.hdf')
   8 T=fid.select('Temperature_A')
   9 Temp=T.get()
  10
  11 #Drucklevel
  12 Lv=[1000.0,925.0,850.0,700.0,600.0,500.0,400.0,300.0,250.0,200.0,150.0,100.0,
  13   70.0, 50.0,30.0, 20.0, 15.0, 10.0,  7.0,5.0, 3.0,2.0,1.5,1.0]
  14
  15 # Temperaturprofile
  16 figure(1)
  17 plot(Temp[:,13,187],Lv)
  18 ylim((1000.0,1.0))
  19 xlim((200.0,280.0))
  20 xlabel('T in Kelvin')
  21 ylabel('p in hPa')
  22 title('used profiles lon=77')
  23 show()
  24 savefig('Soundings1.png',dpi=75)
  25 figure(2)
  26 plot(Temp[:,12,184],Lv)
  27 ylim((1000.0,1.0))
  28 xlim((200.0,280.))
  29 xlabel('T in Kelvin')
  30 ylabel('p in hPa')
  31 title('used profiles lon=78')
  32 show()
  33 savefig('Soundings2.png',dpi=75)
  34 figure(3)
  35 plot(Temp[:,11,187],Lv)
  36 ylim((1000.0,1.0))
  37 xlim((200.0,280.0))
  38 xlabel('T in Kelvin')
  39 ylabel('p in hPa')
  40 title('used profiles lon=79')
  41 show()
  42 savefig('Soundings3.png',dpi=75)
Profile

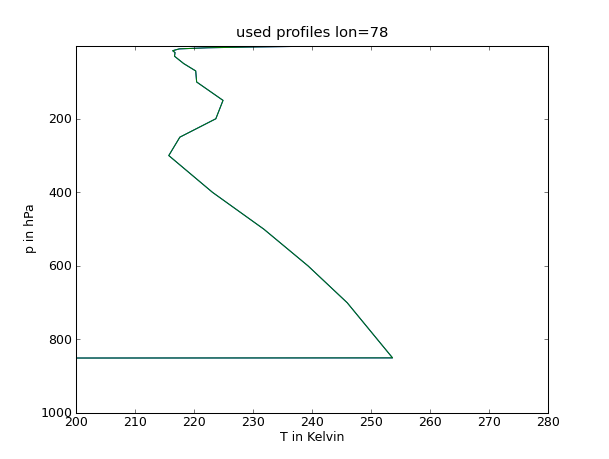
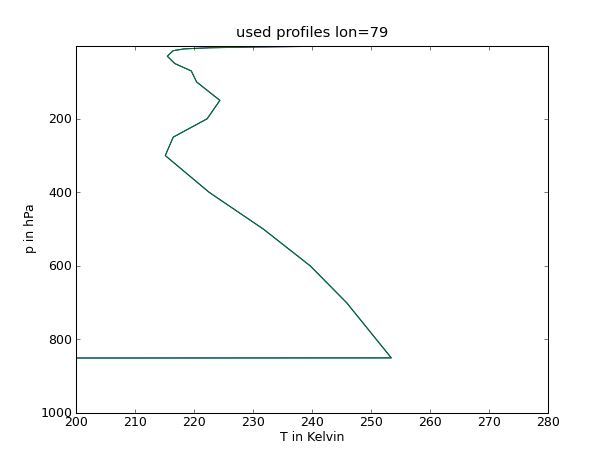
Grenzschichthöhe
Grenzschichtdicke in Meter umrechnen mit barometrischer Höhenformel:
latex error! exitcode was 2 (signal 0), transscript follows:
R=287,1J/kgK
Annahme: T=const. (dadurch wird Grenzschichtdicke unterschätzt)
p=Druckniveau der Wolkenobergrenze
ps=Bodendruck aus Karte
Werte:
Breite |
Dicke in hPa |
Dicke in km |
77 |
165 - 315 |
1,2 - 2,6 |
78 |
90 - 165 |
0,6 - 1,2 |
79 |
90 - 165 |
0,6 - 1,2 |
genauere Bestimmung ist aufgrund der groben Auflösung der Drucklevel nicht möglich: Fehler in Größenordnung 1km
Vergleichen mit Theorie
latex error! exitcode was 2 (signal 0), transscript follows:
