Contents
Basic Python
- Allowed names for identifier
Assignments, e.g. a=1, a,b=1,2, a+=1
Comparisons, e.g. ==, !=
Lists and their methods, e.g. L.append()
Strings and their methods, e.g. .replace(), .split(),
Dictionaries and their methods, e.g. D.keys()
Indexing and slicing, e.g. L[-2:]
Loops, e.g. for i,j in enumerate(['Hund','Katze','Maus']):
Control statements, e.g. if
Importing modules, e.g. import scipy
Getting help, e.g. help()
Defining functions, e.g. def function(x,y):
Working with files, e.g. fid=open(filename,'r')
scipy, numpy, pylab
Array creation, e.g. zeros(), array(), linspace()
Array methods, e.g. .shape(), .reshape(), .tofile(), .flat(), .transpose()
Plotting, e.g. plot(), contour
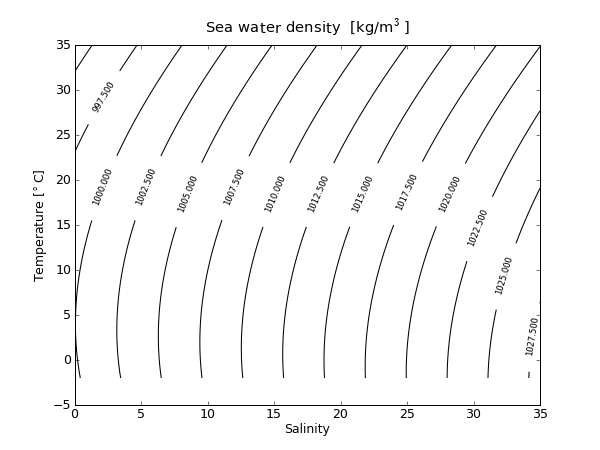
Example:

   1 from pylab import *
   2 # The seawater module is installed only for Python2.6.2
   3 # module load Python/2.6.2
   4 import seawater
   5
   6 S=linspace(0,35)
   7 T=linspace(-2,35.0)
   8
   9 rho=zeros((S.size,T.size))
  10
  11 for i,t in enumerate(T):
  12     rho[i,:]=seawater.dens(S,t)
  13
  14 figure()
  15 CS = contour(S,T,rho,15,colors='k')
  16 clabel(CS, fontsize=8, inline=1)
  17 ylabel('Temperature [$^\circ$C]')
  18 xlabel('Salinity')
  19 title('Sea water density  [kg/m$^3$]')
  20 show()
  21 savefig('density.png',dpi=75)
