Contents
You can read and write any arbitrary binary data format using the struct module. In general it is a better choice to use standard data formats such as NetCDF for scientific data sets. NetCDF introduces an abstraction layer which allows the machine-independent storage and retrieval of data. In addition, the data should include their documentation in the same file.
Modules for scientific data formats
Format\module |
|||||
NetCDF |
read/(write?) |
read |
read/write |
read/write |
|
HDF4 |
|
read/write |
read/write |
read/write |
|
HDF5 |
|
|
read/write |
|
read/write |
GRIB |
|
|
read |
read/write |
|
scipy.io offers a convenient interface to read NetCDF data, the most common scientific data format. Pyhdf is a simple interface to HDF. If you don't need other formats Pyhdf may be a good choice. GDAL has some overhead because of the single abstract data model for all formats but supports the largest number of different satellite formats. PyNIO is an excellent choice for dealing with meteorological and climatological datasets. Since PyNGL/PyNIO recently became open source it can be highly recommended. PyTables could be a choice for dealing with HDF5 if GDAL is not sufficient.
NetCDF
You can use the scipy.io routines to read NetCDF data:
Open a file with fid=scipy.io.netcdf_file(filename,'r')
Print variables with fid.variables.keys()
Read (copy) a variable to an array a=fid.variables[NAME][:].copy()
Close the file fid.close()
Attributes
After opening a NetCDF file you can examine the variable NAME (string) by looking at the methods, e.g. var.attributes or var.dimension:
NetCDF Data Examples
ftp://ftp.ifremer.fr/ifremer/cersat/products/gridded/psi-concentration/data/ Sea ice
http://www.esrl.noaa.gov/psd/data/reanalysis/reanalysis.shtml NCEP/NCAR Atmopsheric Reanalysis
HDF
NASA's standard file format, developed by NCSA. The HDF format is a self-describing data format. HDF files can contain binary data and allow direct access to parts of the file without first parsing the entire contents.
The HDF versions 4 and 5 are not compatible.
Different modules are available for reading and writing HDF files
HDF4 pyhdf
pyhdf is a simple python interface to the NCSA HDF4 library.
The following example demonstrates how to read level-3 data from the Multi-angle Imaging Spectral Radiometer (MISR) on the Terra Satellite
   1 from scipy import array
   2 from pylab import imshow,colorbar,title,savefig
   3 from pyhdf.SD import SD
   4
   5 f=SD('MISR_AM1_CGLS_MAY_2007_F04_0025.hdf')
   6 print f.datasets().keys()
   7 data=array(f.select('NDVI average').get())
   8 data[data<0]=0
   9
  10 imshow(data,interpolation='nearest',cmap=cm.YlGn)
  11 colorbar(shrink=0.5)
  12 title('Normalized Difference Vegetation Index')
Line 5 opens the HDF file object. line 6 prints the keywords of the included datasets. From this one can identify the keyword for the desired parameter. Line 7 reads the data in a SciPy array. Line 8 selects the negative (bad and missing) data and sets them to zero.
HDF5
PyTables is a package for managing hierarchical datasets and designed to efficiently and easily cope with extremely large amounts of data.
Excercise 1
Download NCEP/NCAR reanalysis atmospheric surface temperature monthly mean values. Examine the variables and their attributes.
- What are their dimensions?
- What is the meaning of the dimensions?
- What are the units?
- What are the scaling?
- How are the missing values marked?
- Select the grid cell for the position of Hamburg and plot the temperature time series.
Excercise 2
Write scripts (or try to understand the code below)
to download all Argo data in the Atlantic for the last month, and
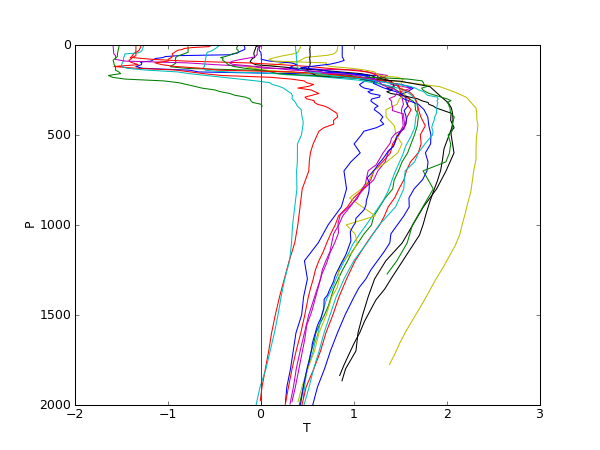
- to plot the pressure against the temperature for only those profiles with a surface temperature below -1 deg C.
   1 #download_argo.py
   2 import os,os.path
   3 from ftplib import FTP
   4
   5 tmp_dir='/home/lars/data/tmp/'
   6 ftp_adr='ftp.ifremer.fr'
   7 ftp_dir='/ifremer/argo/geo/atlantic_ocean/2009/11/'
   8
   9 ftp = FTP(ftp_adr)   # connect to host, default port
  10 ftp.login()          # user anonymous, passwd anonymous@
  11 ftp.cwd(ftp_dir)
  12
  13 file_list=ftp.nlst()
  14
  15 for f in file_list:
  16     urlfile='ftp://'+ftp_adr+ftp_dir+f
  17     localfile=tmp_dir+f
  18
  19     if not(os.path.exists(localfile)):
  20         print 'Getting file '+f
  21          #We use curl instead of ftp.retrbinary for download
  22         os.system("curl -s -k -o "+localfile+"  "+urlfile)
  23     else:
  24         print 'file '+f+' exists'
  25
  26 ftp.close()
   1 #Plot Argo profiles with surface temperature below 1 deg C
   2 import scipy.io as io
   3 import glob
   4 from pylab import *
   5
   6 tmp_dir='/home/lars/data/tmp/'
   7 file_liste=glob.glob(tmp_dir+'*.nc')
   8
   9 D={}# Empty dictionary to store selected profiles
  10 for f in file_liste:
  11     print f
  12
  13     # Open netcdf data file
  14     fid=io.netcdf_file(f,'r')
  15
  16     #print fid.variables.keys()
  17
  18     # Make a copy of the content
  19     lat=fid.variables['LATITUDE'][:].copy()
  20     lon=fid.variables['LONGITUDE'][:].copy()
  21     T=fid.variables['TEMP'][:].copy()
  22     P=fid.variables['PRES'][:].copy()
  23
  24     T[T>=99999]=nan # Set 99999.0 to "Not a Number"
  25     P[P>=99999]=nan
  26
  27     (nr_profs,Z)=T.shape # Get dimension
  28
  29     for i in range(nr_profs):
  30         if T[i,0]<1.0: # Select only those profiles with surface temperature below 1 deg C
  31             # Store profile in dictionary with the position as a key
  32             D[(lat[i],lon[i])]=(T[i,:],P[i,:])
  33     # Close data file
  34     fid.close()
  35
  36
  37 # Plot data
  38 figure()
  39 for k in D.keys():
  40     print k
  41     plot(D[k][0][:],D[k][1][:])
  42 axis([-2,3,2000,0])
  43 xlabel('T')
  44 ylabel('P')
  45 show()
