|
Size: 1600
Comment:
|
Size: 1921
Comment:
|
| Deletions are marked like this. | Additions are marked like this. |
| Line 13: | Line 13: |
| == Example data from Argo system == | = Example data from Argo system = |
| Line 32: | Line 32: |
| == Tools for 2-dimensional interpolation and gridding == | = Tools for 2-dimensional interpolation and gridding = |
| Line 34: | Line 34: |
| === Python === | == Python == |
| Line 36: | Line 36: |
| === GMT === [[http://gmt.soest.hawaii.edu/| |
== GMT == |
| Line 39: | Line 38: |
| {{{nearneighbor lat_lon_T.tab -Rg -I300m -S300m -N1 -Ggrid.nc}}} | [[http://gmt.soest.hawaii.edu/|GMT]] Nearest neighbor gridding with 5 degree grid cell size {{{nearneighbor lat_lon_T.tab -Rd -I300m -S300m -N1 -Ggrid.nc}}} Generate color table: {{{ makecpt -Crainbow -T-2/30/1 > g.cpt }}} {{{ grdimage grid.nc -Rg -JG-45/0/4i -Cg.cpt -K > out.ps }}} {{{ pscoast -Rd -JG-45/0/4i -B15g15 -Dc -Gblack -P -O >> out.ps }}} {{{ gv out.ps }}} {{attachment:out.png}} |
Contents
2-dimensional interpolation and gridding
2-dimensional interpolation and gridding is a common problem for the representation of measurements on a map. Usually measurements are taken at irregular sample points and not in a regular grid. There are various approaches for the problem and the best solution depends on the data.
In the following we will look at oceanographic parameters that have been measured with the Argo system.
Example data from Argo system
Data are provided at, i.e. ftp://ftp.ifremer.fr//ifremer/argo/
First we have to download the data. Here is a /download script that can be used to retrieve one month of Argo data.
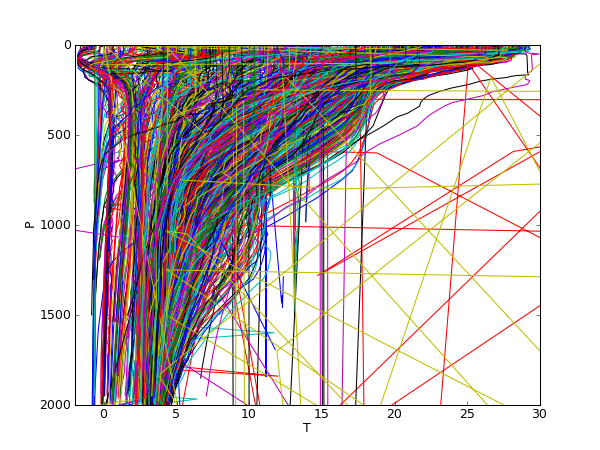
We extract only the surface temperature to reduce the large amount of data. This /extract script generates an overview of the data and writes the surface temperature in a file lat_lon_T.tab which contains latitude, longitude and surface temperature. We can use this file in the following.

Argo positions of measurements

Measured temperature profiles (unfiltered data).
Tools for 2-dimensional interpolation and gridding
Python
GMT
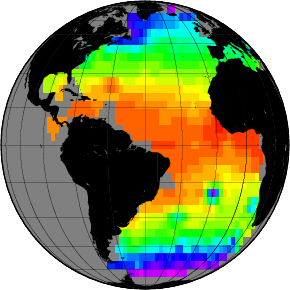
Nearest neighbor gridding with 5 degree grid cell size
nearneighbor lat_lon_T.tab -Rd -I300m -S300m -N1 -Ggrid.nc
Generate color table:
makecpt -Crainbow -T-2/30/1 > g.cpt
grdimage grid.nc -Rg -JG-45/0/4i -Cg.cpt -K > out.ps
pscoast -Rd -JG-45/0/4i -B15g15 -Dc -Gblack -P -O >> out.ps
gv out.ps

