|
Size: 5071
Comment:
|
Size: 4562
Comment:
|
| Deletions are marked like this. | Additions are marked like this. |
| Line 8: | Line 8: |
| Lars Kaleschke, Alexander Loew | '''Lars Kaleschke, Alexander Loew''' |
| Line 26: | Line 26: |
| * [[Climate_and_Satellite_Data_Analysis_2014/Plotting|Plotting]] [[attachment:Seawater plot.ipynb]] | |
| Line 28: | Line 27: |
| * [[http://ipython.org/ipython-doc/dev/interactive/htmlnotebook.html|IPython Notebooks]] [[https://github.com/ipython/ipython/wiki/A-gallery-of-interesting-IPython-Notebooks|Gallery of interesting IPython Notebooks]] * [[attachment:Stochastic analysis of time series.ipynb]] [[attachment:Monte carlo.ipynb]] [[attachment:GISSTEMP netcdf.ipynb]] [[attachment:datetimeobjects.ipynb]] [[attachment:Station data seasonal cycle.ipynb]] |
|
| Line 73: | Line 70: |
| [[/ProjectA]] | |
| Line 77: | Line 73: |
| * Are the trends significant? | * Look at correlations with climate indices, e.g. ENSO, NAO. [[/ProjectA]] |
| Line 80: | Line 78: |
| [[/ProjectB]] | |
| Line 84: | Line 81: |
| * Are the trends significant? | * Are there significant trends over different period of times? |
| Line 88: | Line 85: |
| [[/ProjectB]] |
|
| Line 89: | Line 88: |
| Line 93: | Line 93: |
| * How large is the correlation of the datasets? | * Was the data gap in the Arctic filled in reasonably? |
| Line 95: | Line 95: |
| * Was the data gap in the Arctic filled reasonably? |
Contents
63-953 Climate and Satellite Data Analysis
Lars Kaleschke, Alexander Loew
MS Integrated Climate System Sciences
Date: 3.2.2014-7.2.2014
Place: Geom 1536c
Course objectives
The participants will learn to practically work with climate model, reanalysis, in-situ station and satellite data. Organized as a group project, the participants will further learn the principles of project management and shared software development.
Schedule
Monday
General Introduction
Group work: develop a project plan and write a short technical proposal for your project.
Final report due by 15. March 2014
Obtain data and do preliminary analysis (e.g. data coverage).
Tuesday
Morning: Group presentations of project plan and preliminary analysis.
Afternoon: implementation and project work
Wednesday
Morning: Group presentations of methods and code implementations
Afternoon: Project work
Thursday
Morning: Group presentations of preliminary results
Afternoon: Project work
Friday
Morning: final presenation of results and discussion
Afternoon: evaluation and preparation of final report
Topics for group work
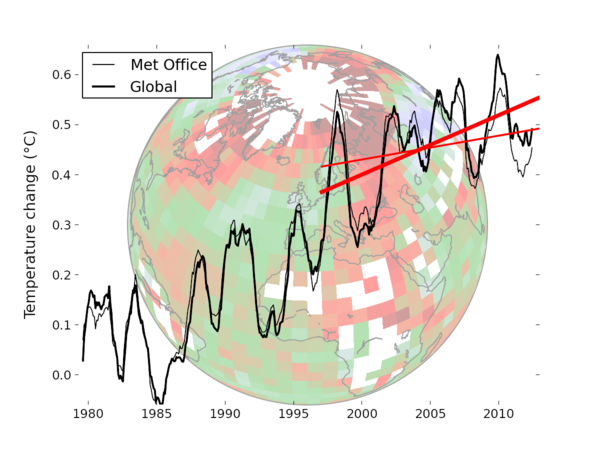
Coverage bias in the HadCRUT4 temperature series and its impact on recent temperature trends

Kevin Cowtan and Robert Way fill the gaps of the HadCRUT temperature data set by using satellite data. Compare their new reconstruction of surface temperature data to independent in-situ observations and reanalysis data.
Cowtan and Way (2013) methods and data are freely available:
Surface temperatures are available from the International Arctic Buoy Programme (IABP) website:
Cowtan and Way (CW2013) reconstruction
- Review methods of Cowtan and Way (2013)
- Analyse their reconstructed dataset of surface air temperature (seasonal cycle, anomalies, trends etc.)
- Look at correlations with climate indices, e.g. ENSO, NAO.
Variations in Surface Air Temperature Observations in the Arctic
- Review methods of Rigor et al. (2000)
- Analyse the surface air temperature measured by the drift buoys (seasonal cycle, anomalies, trends etc.)
- Are there significant trends over different period of times?
Data intercomparison
Use the buoy measurements of surface air temperature as ground truth
- Write code to interpolate the different datasets in a common grid
- Compare CW2013, buoy and reanalysis data
- Was the data gap in the Arctic filled in reasonably?
- Are there biases or jumps in the data?
HOAPS ocean flux sampling bias
HOAPS climatology of ocean surface fluxes
- HOAPS is sampled twice a day
- What is the impact of undersampling the dirnal cycle on monthly means?
- What is the impact of sea ice gaps on monthly means?
- How do HOAPS surface flux estimates compare to literature values of global mean ocean surface fluxes?
TODOs
Data
CW2013

ERA-Interim

NCEP

Bouy data

HOAPS data

Final report
Template structure:
- Abstract
- Introduction: state of the art (literature), statement of the problem
- Methods and data
- Results
- Discussion
- Conlcusion
References
- Python Scripting for Computational Science, Hans Petter Langtangen, Springer (available in the ZMAW library)
Examples from the past
