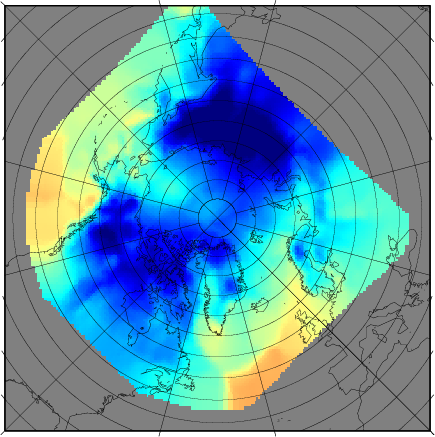
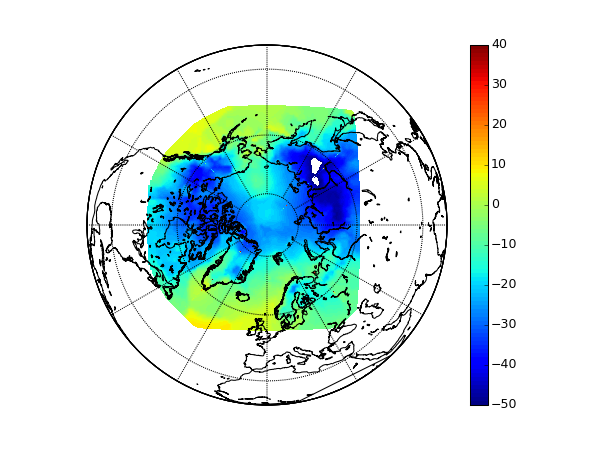
Surface air temperature as provided from IABP
Calculate Lat, Lon for gridded data
   1 import sys,os,os.path,glob,gzip
   2 from pylab import *
   3 import scipy.io as sio
   4 from mpl_toolkits.basemap import Basemap
   5 from gmt_tools import *
   6 from polar_projection import *
   7 import grids
   8
   9 fn='/scratch/local1/loew/climate_data_2014/project_B/data/data_yearly/2004_mean.nc'
  10
  11 fid=sio.netcdf_file(fn,'r')
  12 T=fid.variables['Air_T'][0,:,:]
  13
  14 region='Arctic'
  15 cs=50.0
  16 X,Y=XYgrid(region,cs)
  17 lat,lon=mapxy(X,Y,1) # calculate lat, lon
  18 ###############################
  19
  20
  21 m = Basemap(projection='ortho',lon_0=0.0,lat_0=90.0,resolution='l')
  22 x, y = m(lon,lat)
  23 ps=linspace(-60,40,101)
  24 m.contourf(x,y,T,ps,cmap=cm.jet)
  25 m.drawcoastlines()
  26 m.drawmeridians(arange(0, 360, 30))
  27 m.drawparallels(arange(-90, 90, 30))
  28 colorbar()
  29 show()
Re-gridding using GMT nearneighbor

   1 import sys,os,os.path,glob,gzip
   2 from pylab import *
   3 import scipy.io as sio
   4 from mpl_toolkits.basemap import Basemap
   5 from gmt_tools import *
   6 import grids
   7 import Nio
   8
   9 print "Reading coordinate lookup table"
  10 elatlon=loadtxt("elatlon",usecols=(1,2)).astype(float32)
  11
  12 # Download data
  13 # !wget ftp://iabp.apl.washington.edu/pub/IABP/AirT/OI2004.fld.gz
  14 year="2004"
  15
  16 filename="/scratch/local1/u242023/tmp/OI"+year+".fld.gz"
  17
  18
  19 print "Reading data from file ",filename," please wait ... (could take some minutes)"
  20 d=loadtxt(gzip.open(filename))
  21 print "Selecting indices"
  22
  23 pixel_index_all=d[:,0].astype(int32)
  24 day_all=(d[:,1]/5).astype(int32)
  25 T_air_all=(d[:,2]/100.0).astype(float32)
  26 days=unique(day_all)
  27
  28
  29 for day_i in days:
  30
  31     ind_day=(day_all==day_i) # select time index of one day
  32     pixel_index=pixel_index_all[ind_day] # get pixels indices of one day
  33     lat=elatlon[pixel_index,0] # Select lats and lons from lookup-table
  34     lon=elatlon[pixel_index,1]
  35     T_air=T_air_all[ind_day] # select data of one day
  36
  37     # GRID data on polar sterographic grid
  38     cs=50.0 # 50 km
  39     region='Arctic'
  40     G=grid_par(region,cs,{})
  41     G['S']=' -S'+str(cs*10)+' '
  42     grdfile="/tmp/xyt_tmp.grd"
  43     outfile="out.ps"
  44     ctabfile="ctab"
  45
  46     x,y=mapll(lat,lon,1)# polar stereographic projection
  47
  48     # use GMT NN gridding
  49     nearneighbor(x.astype(float32),y.astype(float32),T_air.astype(float32),grdfile,G)
  50     fid=sio.netcdf_file(grdfile,'r')
  51     T_grid=fid.variables['z'][:,:].copy().astype(float32)
  52
  53     # write to netcdf file
  54     filename_nc=year+'_'+str(day_i)+'.nc'
  55     F=Nio.open_file(filename_nc,'w') #write access
  56     F.create_dimension('my_y',240)
  57     F.create_dimension('my_x',240)
  58     F.create_dimension('my_time',None)
  59     F.create_variable('Air T','f',('my_y','my_x'))
  60     F.variables['Air T'][:,:]=T_grid
  61     F.close()
  62
  63 # Plot data in grdfile
  64 G=makecpt(ctabfile,'jet',-40,30,1,G)
  65 G=anot_par(G)
  66 G['Bll']=' -Ba30g30/a5g5nesw '
  67 G['coast']=' -Dc -W1/0/0/0  '
  68
  69 cmd('grdimage '+grdfile+' '+opts(G,['Rx','Jx','C','Bx'])+' -Y3.5 -K > '+outfile)
  70 cmd('pscoast '+opts(G,['Rll','Bll','coast'])+'  -O  >> '+outfile)
  71 cmd('gv '+outfile+'&')
Re-gridding using Python griddata (slow)

   1 """
   2 Example code to read in the surface air temperature as provided from IABP
   3 Lars Kaleschke, 4.2.2014
   4
   5 """
   6 import sys,os,os.path,glob,gzip
   7 from pylab import *
   8 from mpl_toolkits.basemap import Basemap
   9
  10 print "Reading coordinate lookup table"
  11 elatlon=loadtxt("elatlon",usecols=(1,2)).astype(float32)
  12
  13 # Download data
  14 # !wget ftp://iabp.apl.washington.edu/pub/IABP/AirT/OI2004.fld.gz
  15
  16 filename="OI2004.fld.gz"
  17 print "Reading data from file ",filename," please wait ... (could take some minutes)"
  18 d=loadtxt(gzip.open(filename))
  19 print "Selecting indices"
  20
  21 pixel_index_all=d[:,0].astype(int32)
  22 day_all=(d[:,1]/5).astype(int32)
  23 T_air_all=(d[:,2]/100.0).astype(float32)
  24 days=unique(day_all)
  25
  26 # Select one particular time step (could be used within a loop)
  27 day_i=5
  28
  29 ind_day=(day_all==day_i) # select time index of one day
  30 pixel_index=pixel_index_all[ind_day] # get pixels indices of one day
  31 lat=elatlon[pixel_index,0] # Select lats and lons from lookup-table
  32 lon=elatlon[pixel_index,1]
  33
  34 T_air=T_air_all[ind_day] # select data of one day
  35
  36 print "Creating Basemap instance"
  37 m = Basemap(projection='ortho',lon_0=0.0,lat_0=90.0,resolution='l')
  38
  39 print "Converting lat,lon -> x,y"
  40 x, y = m(lon,lat)
  41
  42 print "Selecting unique coordinates to generate new grid"
  43 X=unique(x)
  44 Y=unique(y)[::-1]
  45
  46 print "Gridding data to new grid"
  47 T_grid=griddata(x,y,T_air,X,Y)
  48
  49 x_grid,y_grid=meshgrid(X,Y)
  50 ps=linspace(-60,40,101)
  51
  52 print "Plotting data"
  53 m.contourf(x_grid,y_grid,T_grid,ps,cmap=cm.jet)
  54 m.drawcoastlines()
  55 m.drawmeridians(arange(0, 360, 30))
  56 m.drawparallels(arange(-90, 90, 30))
  57 colorbar()
  58 print "Show plot on screen"
  59 show()
  60
  61 print "Finished"