die Besprechung ergab fuer diese Gruppe:
- Trockenprogrammierung: insbesondere die Konsistenz von Bildkoordinaten von ASAR und Freibord-Footprint klären die Klasseneinteilungen von ASAR und Freibordhöhen vergleichen Frage "welche Statistik will man anwenden" beantworten
Dienstag
Am Dienstag / Mittwoch erzeugtes Programm, das mit dem Zufallsgenerator sowohl die ASAR als auch Freibord - Daten erzeugt:
   1 #project_plot.py
   2
   3 from pylab import *
   4 from scipy import *
   5 import time,calendar,os,pipes,struct,string
   6 import random
   7 import scipy.ndimage as ndi
   8 from matplotlib.patches import Ellipse
   9
  10 nk=5 #number of classes
  11 ndim=[1000,1000] #dimension of ASAR image in pixels
  12 res=12.5
  13 freeb_asar_pixels=int(60./res)# footprint of freeboard is 60m
  14
  15 fx0,fy0,fx2,fy2=[0.2,1.,1.,0.1]
  16 fx0,fy0,fx2,fy2=fx0*ndim[0],fy0*ndim[0],fx2*ndim[0],fy2*ndim[0] # freeboard coordinates from input file
  17 dist=sqrt((fx2-fx0)**2+(fy2-fy0)**2)*res
  18 fdist=172 #distance of two freeboard footprints is 172m
  19 nf=int(dist/fdist)
  20
  21 fz_h=zeros(nf) #fz_h is the freeboard heights
  22 # produce a random array of freeboard heights
  23 for i in range(nf):
  24    fz_h[i]=random.random()*70
  25
  26 # the x,y positions of the freeboard footprints
  27 if fx2==fx0:
  28    fx=zeros(nf)+fx0
  29    fy=linspace(0,ndim[1],nf)
  30 else:
  31    teta=(fy2-fy0)/(fx2-fx0)
  32    fx=linspace(fx0,fx2,nf)
  33    fy=(fx-fx0)*teta+fy0
  34
  35 #produce a random matrix of ASAR image classes (in 5 classes)
  36 a=zeros((ndim[0],ndim[1]))
  37 for i in range(ndim[0]):
  38    for j in range(ndim[1]):
  39       a[i,j]=int(random.random()*(nk)+1)
  40
  41 #tranform from float to int
  42 B=a.astype(int)
  43
  44 #select the class of footprints from ASAR Image
  45 fz=zeros(nf)
  46 for i in range(nf):
  47    fz[i]=B[int(fx[i]-1),int(fy[i]-1)]
  48
  49 #calculation of mean and standard deviation of freeboard heights in each class
  50 mean=zeros(nk)
  51 std_kl=zeros(nk)
  52 for kl in range(1,6):
  53    s=(fz==kl)
  54    fh_kl=fz_h[s]
  55    mean[kl-1]=fh_kl.sum()/fh_kl.shape[0]
  56    std_kl[kl-1]=std(fh_kl)
  57
  58 #plot mean and error bar
  59 kl=arange(nk)+1
  60 bar(kl,mean,yerr=std_kl,ecolor='r',align='center')
  61 axis('tight')
  62 savefig('kl_mean_std', orientation='portrait', format='png')
  63
  64 #calculate correlation coefficient
  65 #corr=xcorr(fz,fz_h,normed=True)[1][nf]
  66
  67 figure()
  68 #plot ASAR image class together with freeboard heights
  69 x=arange(nf)
  70 bar(x,fz,width=0.3,align='center')
  71 ylim(0,10)
  72 ax=twinx()
  73 plot(x,fz_h,'r+-',ms=10,linewidth=1)
  74 ylim(0,70)
  75 savefig('asar_fb', orientation='portrait', format='png')
  76
  77 #axis('tight')
  78
  79 #plot ASAR image with freeboard flight
  80 figure()
  81 ct=zeros((nf,4))
  82 for i in range(nf):
  83    ct[i]=cm.gist_rainbow(int(fz_h[i]))
  84 ax=axes()
  85 ells=[Ellipse(xy=[fx[i],fy[i]],width=freeb_asar_pixels,height=freeb_asar_pixels) for i in xrange(nf)]
  86 n=0
  87 for e in ells:
  88    ax.add_artist(e)
  89    e.set_clip_box(ax.bbox)
  90    e.set_alpha(0.5)
  91    e.set_facecolor(ct[n])
  92    n+=1
  93 gray()
  94 imshow(B,origin='lower',interpolation=None)
  95 hold(True)
  96 #plot(fx,fy,'r+-',linewidth=2)
  97 xlim(400,600)
  98 ylim(500,700)
  99 #xlim(0,1000)
 100 #ylim(0,1000)
 101 colorbar()
 102 savefig('asar_fb_track', orientation='portrait', format='png')
 103
 104 #figure()
 105 #imshow(a)
 106 show()
Figure 1 (class - mean, standard deviation) / VIRTUELLE DATEN :
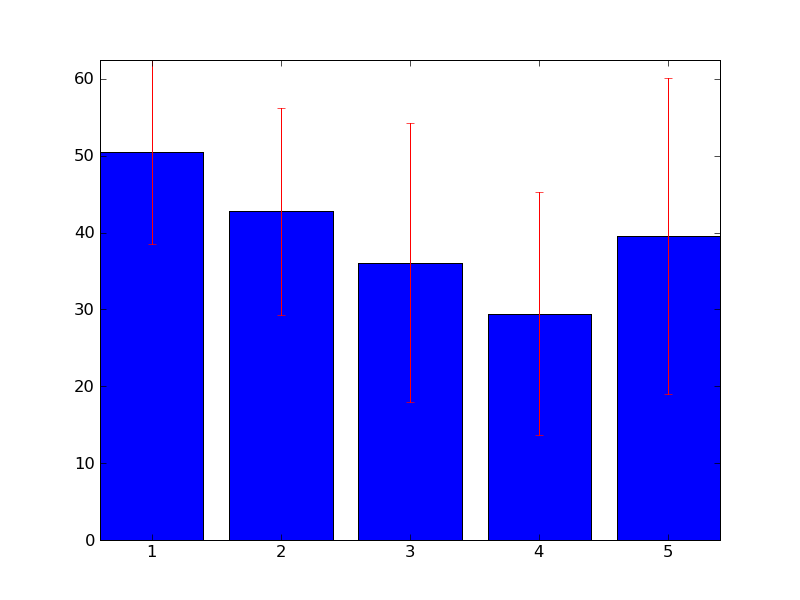
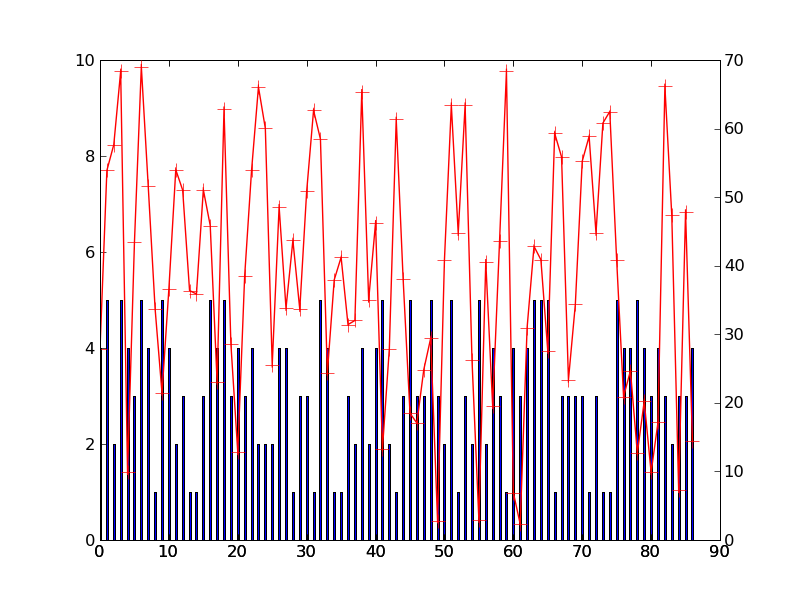
Figure 2 (asar, freboard) / VIRTUELLE DATEN :
Ziele für Mittwoch:
- Vom gestern erzeugte Graphen verfeinen
Programm für ASAR-Rohdaten & Freiborddaten Vergleich
Mittwoch
Am Mittwoch erzeugtes Programm, das ASAR-Rohdaten und Freiborddaten (Zufallsgenerator), Faltungmaske 5x5 Pixel wurde benutzt:
   1 #ASAR_raw.py
   2
   3 from pylab import *
   4 from scipy import *
   5 import time,calendar,os,pipes,struct,string
   6 import random
   7 import scipy.ndimage as ndi
   8 from read_asar import *
   9
  10 filename='/pf/u/u242027/SAR_raw/ASA_IMP_1PNDPA20060617_043346_000000162048_00362_22460_2136.N1'
  11 I=read_asar_imp(filename)
  12
  13 ndim=[1000,1000] #dimension of ASAR image in pixels
  14
  15 fx0,fy0,fx2,fy2=[200.,1000.,1000.,100.] # freeboard coordinates from input file
  16 cellsize=12.5 #12.5m pixelsize
  17 dist=sqrt((fx2-fx0)**2+(fy2-fy0)**2)*cellsize
  18 fdist=172 #distance of two freeboard footprints is 172m
  19 nf=dist/fdist
  20
  21 fz_h=zeros(nf) #fz_h is the freeboard heights
  22 # produce a random array of freeboard heights
  23 for i in range(nf):
  24    fz_h[i]=random.random()*70
  25
  26 # the x,y positions of the freeboard footprints
  27 if fx2==fx0:
  28    fx=zeros(nf)+fx0
  29    fy=linspace(0,ndim[1],nf)
  30 else:
  31    teta=(fy2-fy0)/(fx2-fx0)
  32    fx=linspace(fx0,fx2,nf)
  33    fy=(fx-fx0)*teta+fy0
  34
  35
  36 B=I[1000:2000,1000:2000]
  37
  38 mask=array(([1,1,1,1,1],[1,2,2,2,1],[1,2,3,2,1],[1,2,2,2,1],[1,1,1,1,1]))/35.
  39 C=ndimage.convolve(B,mask,mode='reflect')
  40
  41 #select the intensity value of footprints from ASAR Image
  42 fz=zeros(nf)
  43 for i in range(nf):
  44    pos=[int(fx[i]-1),int(fy[i]-1)]
  45    fz[i]=B[pos[0],pos[1]]
  46
  47
  48 #calculate correlation coefficient
  49 corr=xcorr(fz,fz_h,normed=True)[1][nf]
  50
  51 figure()
  52 #plot ASAR image intensity together with freeboard heights
  53 x=arange(int(nf))
  54 plot(x,fz,'b+-')
  55 ax=twinx()
  56 plot(x,fz_h,'r+-')
  57 savefig('asar_fb_track_RAW', orientation='portrait', format='png')
  58
  59 #plot ASAR image with freeboard flight
  60 #figure()
  61 #plot(fx,fy,'r+-',linewidth=2)
  62 #colorbar()
  63 #imshow(B,origin='lower',interpolation=None)
  64 #hold(True)
  65
  66 show()
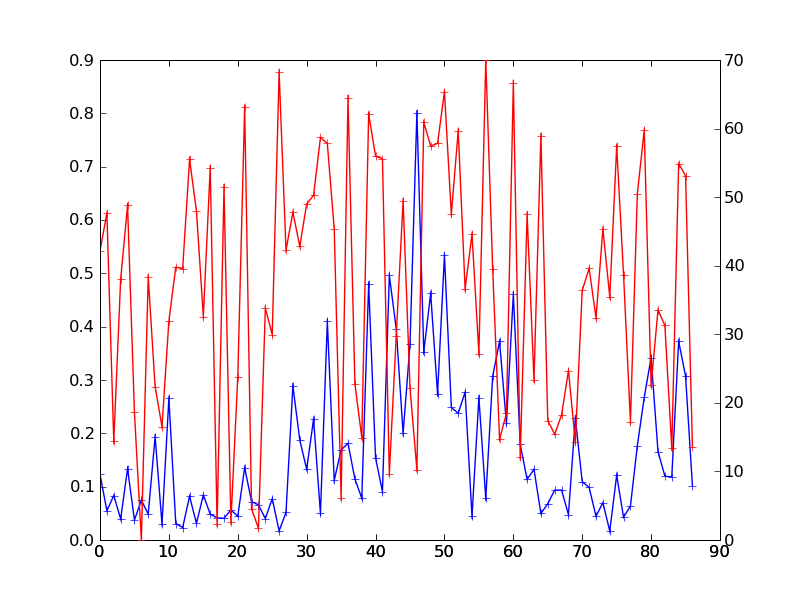
Figure 1 (raw asar image, freeboard) / REELLE ASAR DATEN + VIRTUELLER FREIBORDDATENSATZ ::
Ziele für Donnerstag:
- Farbtabelle für Freibordhöhen einbauen
- Programpaketen der anderen Gruppe übernehmen und ins Programm einbauen
- Testen und erste Ergebnisse liefern
- Bericht schreiben
Donnerstag
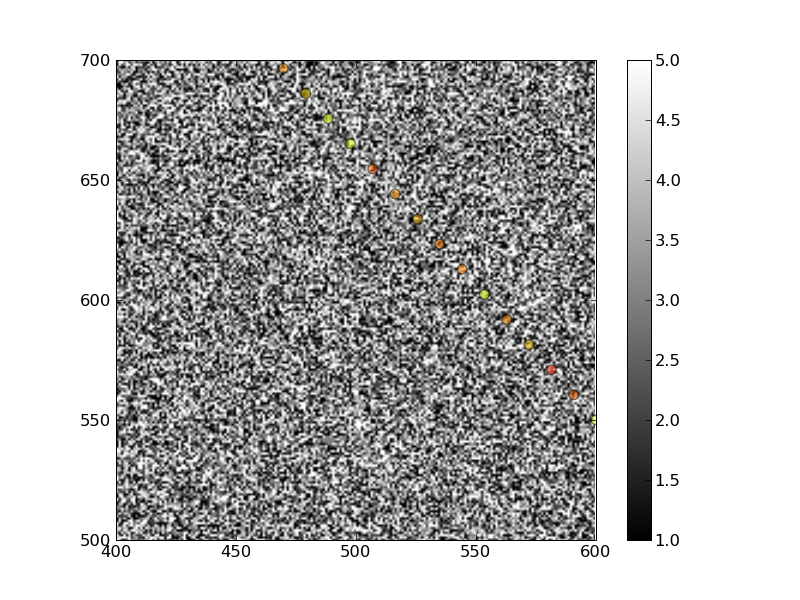
Am Donnerstag erzeugte Farbtabelle im 'project_plot.py' Program für Freibordhöhen:
Figure 3 (asar, freeboard track) / VIRTUELLE DATEN :
vergleichen Frage "welche Statistik will man anwenden" beantworten
Freitag
Am Freitag wurden die Teilprogramme zusammengesetzt und das Hauptprogram geschrieben. Die Bericht wurde geschrieben.
Program "results.py" nimmt als input die Freibordposition (fx,fy), Freibordhöhe (fz_h) und das klassifizierte ASAR Bild an.:
   1 #results.py
   2 from pylab import *
   3 from scipy import *
   4 import time,calendar,os,pipes,struct,string
   5 import random
   6 import scipy.ndimage as ndi
   7 from matplotlib.patches import Ellipse
   8
   9
  10
  11 def results(fx,fy,fz_h,B):
  12     nk=B.max() #number of classes
  13     ndim=B.shape
  14     fx=fx*ndim[0]
  15     fy=fy*ndim[1]
  16     nf=fx.shape[0]
  17     res=12.5
  18     freeb_asar_pixels=int(60./res)# footprint of freeboard is 60m
  19     #select the class of footprints from ASAR Image
  20     fz=zeros(nf)
  21     for i in range(nf):
  22       fz[i]=B[int(fx[i]-1),int(fy[i]-1)]
  23
  24     #calculation of mean and standard deviation of freeboard heights in each class
  25     mean=zeros(nk)
  26     std_kl=zeros(nk)
  27     for kl in range(nk):
  28       s=(fz==kl)
  29       fh_kl=fz_h[s]
  30       mean[kl]=fh_kl.sum()/fh_kl.shape[0]
  31       std_kl[kl]=std(fh_kl)
  32
  33     #plot mean and error bar
  34     kl=arange(nk)
  35     bar(kl,mean,yerr=std_kl,ecolor='r',align='center')
  36     axis('tight')
  37     savefig('kl_mean_std.png', orientation='portrait', format='png')
  38
  39     #calculate correlation coefficient
  40     #corr=xcorr(fz,fz_h,normed=True)[1][nf]
  41
  42     figure()
  43     #plot ASAR image class together with freeboard heights
  44     x=arange(nf)
  45     bar(x,fz,width=0.3,align='center')
  46     ax=twinx()
  47     plot(x,fz_h,'r+-',ms=10,linewidth=1)
  48     savefig('asar_fb.png', orientation='portrait', format='png')
  49
  50     #axis('tight')
  51
  52     #plot ASAR image with freeboard flight
  53     figure()
  54     ct=zeros((nf,4))
  55     for i in range(nf):
  56       ct[i]=cm.gist_rainbow(int(fz_h[i]))
  57     ax=axes()
  58     ells=[Ellipse(xy=[fx[i],fy[i]],width=freeb_asar_pixels,height=freeb_asar_pixels) for i in xrange(nf)]
  59     n=0
  60     for e in ells:
  61       ax.add_artist(e)
  62       e.set_clip_box(ax.bbox)
  63       e.set_alpha(0.5)
  64       e.set_facecolor(ct[n])
  65       n+=1
  66     gray()
  67     imshow(B,origin='lower',interpolation=None)
  68     hold(True)
  69     #plot(fx,fy,'r+-',linewidth=2)
  70     colorbar()
  71     savefig('asar_fb_track.png', orientation='portrait', format='png')
  72
  73     #figure()
  74     #imshow(a)
  75     show()
HAUPTPROGRAM "project_woche.py", das die Module aller Gruppen aufruft und durchführt:
   1 #project_woche.py
   2
   3 import read_fh
   4 import asar_kl
   5 from results import *
   6 from pylab import *
   7 from scipy import *
   8 import time,calendar,os,pipes,struct,string
   9 import scipy.ndimage as ndi
  10 from matplotlib.patches import Ellipse
  11
  12 filename1='/pf/u/u242027/ASA_IMP_1PNDPA20060617_043346_000000162048_00362_22460_2136.N1'
  13 filename2='/pf/u/u242027/LonLatFre_1706_6.xyz'
  14 filename3='/pf/u/u241110/project/asar_class_filtered_1090x1051.dat'
  15
  16 fx,fy,fz_h=read_fh.fit_freeboard_ASAR(filename1,filename2)
  17 ndim=[1090,1051] #dimension of ASAR image in pixels
  18 B=reshape(fromfile(filename3),(ndim[0],ndim[1]))
  19 results(fx,fy,fz_h,B)
Figure 1 (class - mean, standard deviation) / REELLE DATEN :
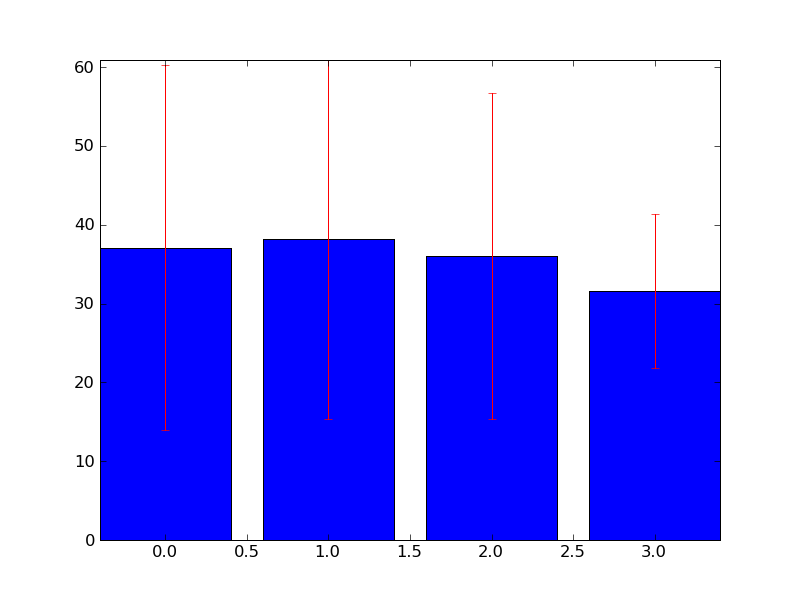
Figure 2 (asar, freboard) / REELLE DATEN :
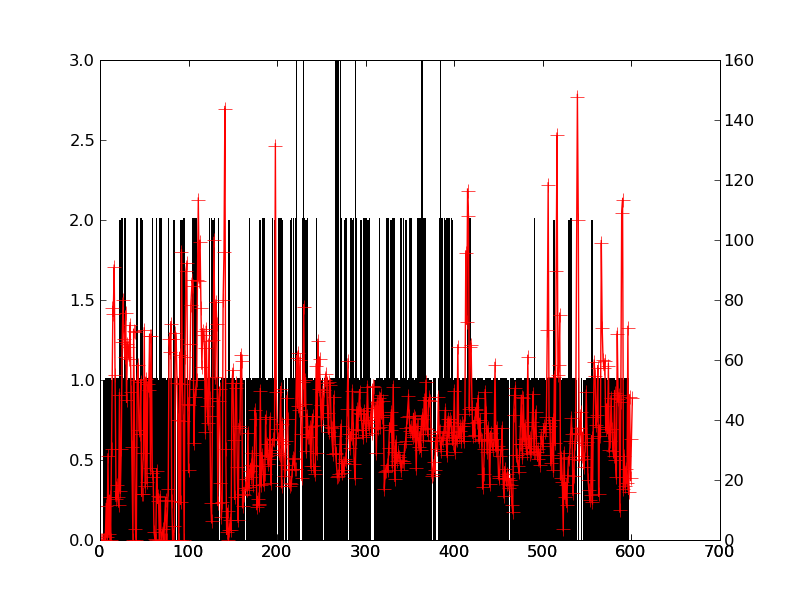
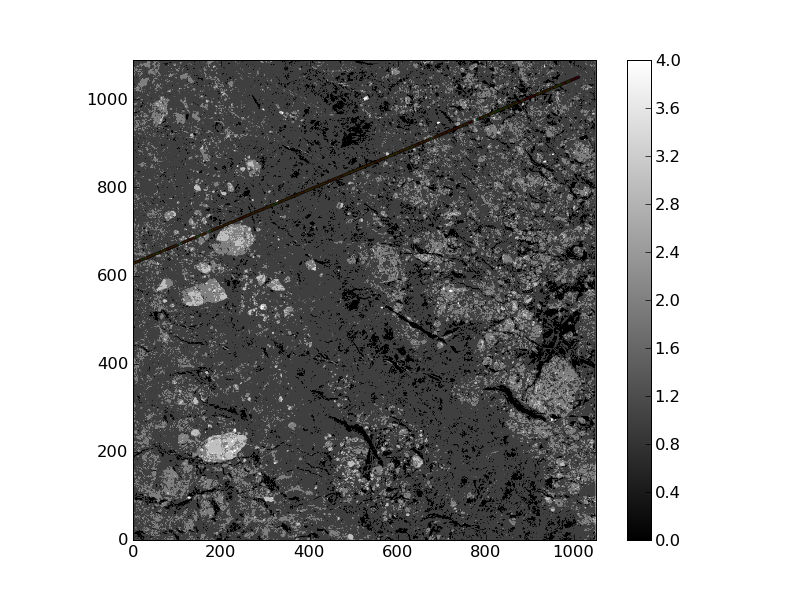
Figure 3 (asar, freeboard track) / REELE DATEN :
- Berichtteil (Zusammenbau):
Motivation
Das Ziel von unserem Projekt ist die Klassifikation der Freibordhöhen im Gebiet des Weddellmeeres (Antarktis). Dazu stehen uns ICESat und ENVISAT Daten zur Verfügung. Unsere Aufgabenstellung besteht darin festzustellen, ob es möglich ist, die ASAR Daten für eine Eisdickenklassifikation benutzen zu können. Die ICESat Überflugsdaten werden bei der Validierung helfen.Des weiteren fragen wir uns, im welchem Fehlerbereich diese Klassifikation möglich ist.
Daten
In der erste Phase unseres Projektes haben wir mit Daten gearbeitet, die mit dem Zufallsgenerator erzeugt worden sind. Später haben wir die Programme anderer Gruppen eingebaut, dessen Eingabe a) die Freibordhöhen in den Bildkoordinaten und b) das Array der klassifizierten ASAR Datei war.
Methodik (Arbeitsschritten, Theorie, Input/Output)
Als erste Aufgabe haben wir uns damit beschäftigt, wie man den Zufallsgenerator benutzen kann. Mittels der Funktion "random()" haben wir das klassifizierte ASAR-Testbild (1000x1000 Pixels, 12,5 Meter Pixelgröße) mit dem simulierten ICESat-Überflug erzeugt. Das klassifizierte ASAR-Bild enthältet 5 Klassen (nk), die als dritte Dimension zu der Bildkoordinate zugehört (fx,fy,Klasse). Der ICESat-Überflug bestand aus Punkten mit Abständen von 172 Meter, wobei nur die erste und letzte Koordinate (fx0,fy0,fx2,fy2) normiert (0-1) eingegeben wird. Die normierte Koordinaten haben wir mit der Dimension (1000x1000) multipliziert um die Freibordpunkte in den richtigen Bildkoordinaten zu bekommen. Aus der Distanz zwischen dem ersten und letzten Punk haben wir bei dem bekannten Abstand die Punktenzahl (nf) berechnet.
Es wurden nur die unter Freibordpunkten liegenden ASAR-Klassen (fz) in der Korrelationsberechnung berücksichtigt und anschließend der Mittelwert und die Standardabweichung für die Freibordhöhe in jeder Klasse berechnet (siehe unterliegende Bild). 
Danach haben wir die Teilprogramme von den anderen Gruppen erhalten.
Ergebnisse (Output, Statistik)
Figure 1 (class - mean, standard deviation) / REELLE DATEN :

Figure 2 (asar, freboard) / REELLE DATEN :

Figure 3 (asar, freeboard track) / REELE DATEN :

Diskussion
- Hypothese: "Es ist möglich die Eisdicke/Freibordhöhe mittels ASAR Daten zu klassifizieren."
- "Die ICESat Daten werden uns dabei helfen, die klassifizierte Bilder zu validieren."
- Im welchem Fehlerbereich diese Klassifikation möglich ist?