|
Size: 5956
Comment:
|
Size: 6072
Comment:
|
| Deletions are marked like this. | Additions are marked like this. |
| Line 5: | Line 5: |
| Dienstag | __'''Dienstag'''__ |
| Line 9: | Line 9: |
| Line 39: | Line 38: |
| # the x,y positions of the freeboard footprints | # the x,y positions of the freeboard footprints |
| Line 60: | Line 59: |
| #select the class of footprints from ASAR Image | #select the class of footprints from ASAR Image |
| Line 72: | Line 71: |
| std_kl[kl-1]=std(fh_kl) | std_kl[kl-1]=std(fh_kl) |
| Line 79: | Line 78: |
| #calculate correlation coefficient |
#calculate correlation coefficient |
| Line 84: | Line 83: |
| #plot ASAR image class together with freeboard heights | #plot ASAR image class together with freeboard heights |
| Line 125: | Line 124: |
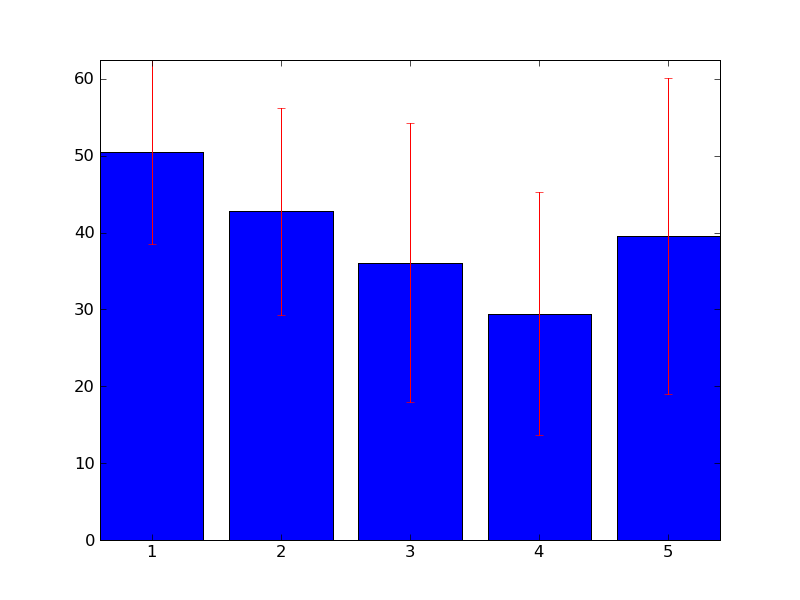
| Figure 1 (class - mean, standard deviation): | Figure 1 (class - mean, standard deviation) / '''VIRTUELLE DATEN''' : |
| Line 129: | Line 129: |
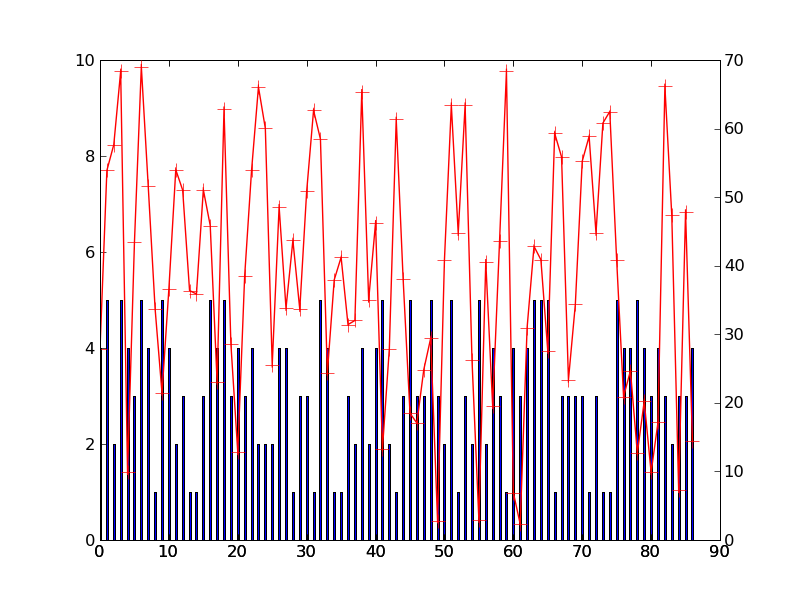
| Figure 2 (asar, freboard): | Figure 2 (asar, freboard) / '''VIRTUELLE DATEN''' : |
| Line 132: | Line 132: |
| Line 139: | Line 138: |
| '''Mittwoch ''' |
'''Mittwoch ''' |
| Line 143: | Line 142: |
| Line 173: | Line 171: |
| # the x,y positions of the freeboard footprints | # the x,y positions of the freeboard footprints |
| Line 188: | Line 186: |
| #select the intensity value of footprints from ASAR Image | #select the intensity value of footprints from ASAR Image |
| Line 195: | Line 193: |
| #calculate correlation coefficient | #calculate correlation coefficient |
| Line 199: | Line 197: |
| #plot ASAR image intensity together with freeboard heights | #plot ASAR image intensity together with freeboard heights |
| Line 216: | Line 214: |
Figure 1 (raw asar image, freeboard): |
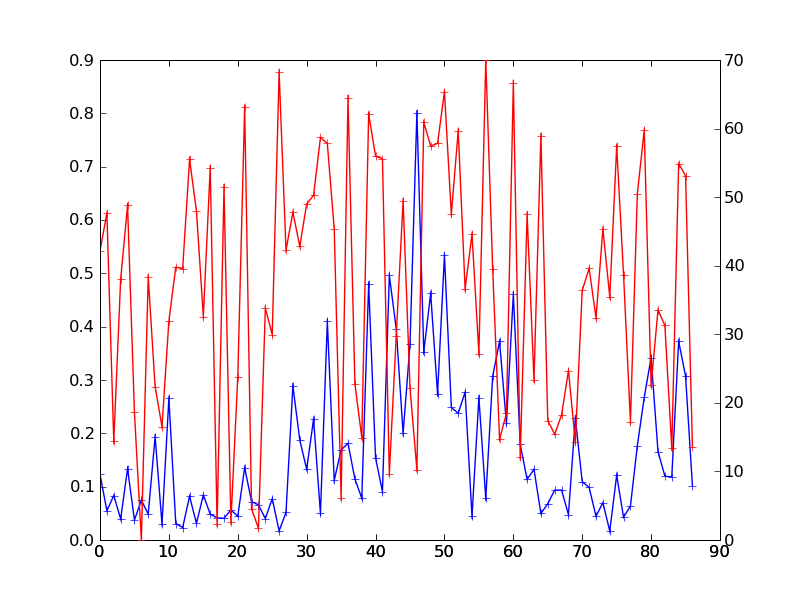
Figure 1 (raw asar image, freeboard) / '''REELLE ASAR DATEN + VIRTUELLER FREIBORDDATENSATZ''' :: |
| Line 223: | Line 220: |
| '''Ziele für Donnerstag<<BR>>''' | '''Ziele für Donnerstag:''' |
| Line 230: | Line 227: |
| '''Donnerstag ''' |
'''Donnerstag ''' |
| Line 233: | Line 230: |
| Line 236: | Line 232: |
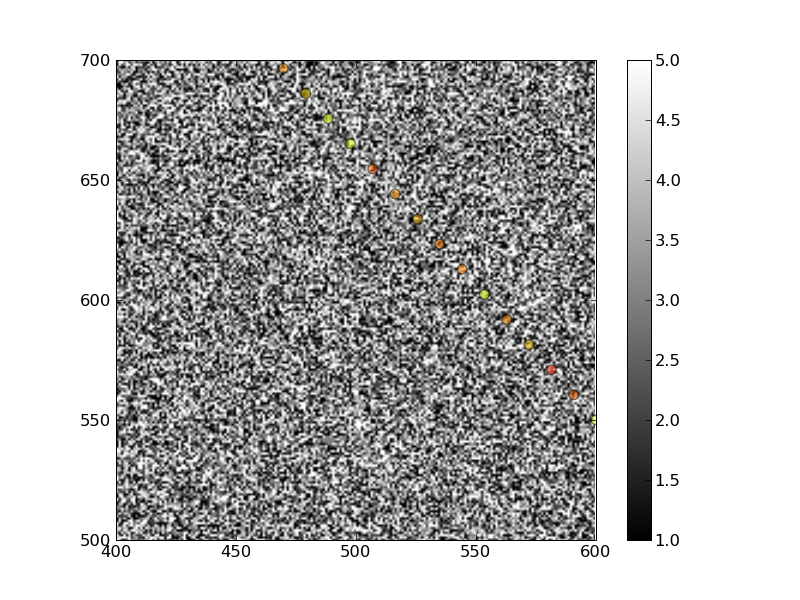
| Figure 3 (asar, freeboard track): | Figure 3 (asar, freeboard track) / '''VIRTUELLE DATEN''' : |
die Besprechung ergab fuer diese Gruppe:
- Trockenprogrammierung: insbesondere die Konsistenz von Bildkoordinaten von ASAR und Freibord-Footprint klären die Klasseneinteilungen von ASAR und Freibordhöhen vergleichen Frage "welche Statistik will man anwenden" beantworten
Dienstag
Am Dienstag / Mittwoch erzeugtes Programm, das mit dem Zufallsgenerator sowohl die ASAR als auch Freibord - Daten erzeugt:
   1 #project_plot.py
   2
   3 from pylab import *
   4 from scipy import *
   5 import time,calendar,os,pipes,struct,string
   6 import random
   7 import scipy.ndimage as ndi
   8 from matplotlib.patches import Ellipse
   9
  10 nk=5 #number of classes
  11 ndim=[1000,1000] #dimension of ASAR image in pixels
  12 res=12.5
  13 freeb_asar_pixels=int(60./res)# footprint of freeboard is 60m
  14
  15 fx0,fy0,fx2,fy2=[0.2,1.,1.,0.1]
  16 fx0,fy0,fx2,fy2=fx0*ndim[0],fy0*ndim[0],fx2*ndim[0],fy2*ndim[0] # freeboard coordinates from input file
  17 dist=sqrt((fx2-fx0)**2+(fy2-fy0)**2)*res
  18 fdist=172 #distance of two freeboard footprints is 172m
  19 nf=int(dist/fdist)
  20
  21 fz_h=zeros(nf) #fz_h is the freeboard heights
  22 # produce a random array of freeboard heights
  23 for i in range(nf):
  24    fz_h[i]=random.random()*70
  25
  26 # the x,y positions of the freeboard footprints
  27 if fx2==fx0:
  28    fx=zeros(nf)+fx0
  29    fy=linspace(0,ndim[1],nf)
  30 else:
  31    teta=(fy2-fy0)/(fx2-fx0)
  32    fx=linspace(fx0,fx2,nf)
  33    fy=(fx-fx0)*teta+fy0
  34 #produce a random matrix of ASAR image classes (in 3 classes)
  35
  36 a=zeros((ndim[0],ndim[1]))
  37 for i in range(ndim[0]):
  38    for j in range(ndim[1]):
  39       a[i,j]=int(random.random()*(nk)+1)
  40
  41 #tranform from float to int
  42
  43 #A=ndimage.gaussian_filter(a,1)+0.5
  44 #B=A.astype(int)
  45 B=a.astype(int)
  46
  47 #select the class of footprints from ASAR Image
  48 fz=zeros(nf)
  49 for i in range(nf):
  50    fz[i]=B[int(fx[i]-1),int(fy[i]-1)]
  51
  52 #calculation of mean and standard deviation of freeboard heights in each class
  53 mean=zeros(nk)
  54 std_kl=zeros(nk)
  55 for kl in range(1,6):
  56    s=(fz==kl)
  57    fh_kl=fz_h[s]
  58    mean[kl-1]=fh_kl.sum()/fh_kl.shape[0]
  59    std_kl[kl-1]=std(fh_kl)
  60
  61 #plot mean and error bar
  62 kl=arange(nk)+1
  63 bar(kl,mean,yerr=std_kl,ecolor='r',align='center')
  64 axis('tight')
  65 savefig('kl_mean_std', orientation='portrait', format='png')
  66
  67 #calculate correlation coefficient
  68 #corr=xcorr(fz,fz_h,normed=True)[1][nf]
  69
  70 figure()
  71 #plot ASAR image class together with freeboard heights
  72 x=arange(nf)
  73 bar(x,fz,width=0.3,align='center')
  74 ylim(0,10)
  75 ax=twinx()
  76 plot(x,fz_h,'r+-',ms=10,linewidth=1)
  77 ylim(0,70)
  78 savefig('asar_fb', orientation='portrait', format='png')
  79
  80 #axis('tight')
  81
  82 #plot ASAR image with freeboard flight
  83 figure()
  84 ct=zeros((nf,4))
  85 for i in range(nf):
  86    ct[i]=cm.gist_rainbow(int(fz_h[i]))
  87 ax=axes()
  88 ells=[Ellipse(xy=[fx[i],fy[i]],width=freeb_asar_pixels,height=freeb_asar_pixels) for i in xrange(nf)]
  89 n=0
  90 for e in ells:
  91    ax.add_artist(e)
  92    e.set_clip_box(ax.bbox)
  93    e.set_alpha(0.5)
  94    e.set_facecolor(ct[n])
  95    n+=1
  96 gray()
  97 imshow(B,origin='lower',interpolation=None)
  98 hold(True)
  99 #plot(fx,fy,'r+-',linewidth=2)
 100 xlim(400,600)
 101 ylim(500,700)
 102 #xlim(0,1000)
 103 #ylim(0,1000)
 104 colorbar()
 105 savefig('asar_fb_track', orientation='portrait', format='png')
 106
 107 #figure()
 108 #imshow(a)
 109 show()
Figure 1 (class - mean, standard deviation) / VIRTUELLE DATEN :

Figure 2 (asar, freboard) / VIRTUELLE DATEN :

Ziele für Mittwoch:
- Vom gestern erzeugte Graphen verfeinen
Programm für ASAR-Rohdaten & Freiborddaten Vergleich
Mittwoch
Am Mittwoch erzeugtes Programm, das ASAR-Rohdaten und Freiborddaten (Zufallsgenerator), Faltungmaske 5x5 Pixel wurde benutzt:
   1 #ASAR_raw.py
   2
   3 from pylab import *
   4 from scipy import *
   5 import time,calendar,os,pipes,struct,string
   6 import random
   7 import scipy.ndimage as ndi
   8 from read_asar import *
   9
  10 filename='/pf/u/u242027/SAR_raw/ASA_IMP_1PNDPA20060617_043346_000000162048_00362_22460_2136.N1'
  11 I=read_asar_imp(filename)
  12
  13 ndim=[1000,1000] #dimension of ASAR image in pixels
  14
  15 fx0,fy0,fx2,fy2=[200.,1000.,1000.,100.] # freeboard coordinates from input file
  16 cellsize=12.5 #12.5m pixelsize
  17 dist=sqrt((fx2-fx0)**2+(fy2-fy0)**2)*cellsize
  18 fdist=172 #distance of two freeboard footprints is 172m
  19 nf=dist/fdist
  20
  21 fz_h=zeros(nf) #fz_h is the freeboard heights
  22 # produce a random array of freeboard heights
  23 for i in range(nf):
  24    fz_h[i]=random.random()*70
  25
  26 # the x,y positions of the freeboard footprints
  27 if fx2==fx0:
  28    fx=zeros(nf)+fx0
  29    fy=linspace(0,ndim[1],nf)
  30 else:
  31    teta=(fy2-fy0)/(fx2-fx0)
  32    fx=linspace(fx0,fx2,nf)
  33    fy=(fx-fx0)*teta+fy0
  34
  35
  36 B=I[1000:2000,1000:2000]
  37
  38 mask=array(([1,1,1,1,1],[1,2,2,2,1],[1,2,3,2,1],[1,2,2,2,1],[1,1,1,1,1]))/35.
  39 C=ndimage.convolve(B,mask,mode='reflect')
  40
  41 #select the intensity value of footprints from ASAR Image
  42 fz=zeros(nf)
  43 for i in range(nf):
  44    pos=[int(fx[i]-1),int(fy[i]-1)]
  45    fz[i]=B[pos[0],pos[1]]
  46
  47
  48 #calculate correlation coefficient
  49 corr=xcorr(fz,fz_h,normed=True)[1][nf]
  50
  51 figure()
  52 #plot ASAR image intensity together with freeboard heights
  53 x=arange(int(nf))
  54 plot(x,fz,'b+-')
  55 ax=twinx()
  56 plot(x,fz_h,'r+-')
  57 savefig('asar_fb_track_RAW', orientation='portrait', format='png')
  58
  59 #plot ASAR image with freeboard flight
  60 #figure()
  61 #plot(fx,fy,'r+-',linewidth=2)
  62 #colorbar()
  63 #imshow(B,origin='lower',interpolation=None)
  64 #hold(True)
  65
  66 show()
Figure 1 (raw asar image, freeboard) / REELLE ASAR DATEN + VIRTUELLER FREIBORDDATENSATZ ::

Ziele für Donnerstag:
- Farbtabelle für Freibordhöhen einbauen
- Programpaketen der anderen Gruppe übernehmen und ins Programm einbauen
- Testen und erste Ergebnisse liefern
- Bericht schreiben
Donnerstag
Am Donnerstag erzeugte Farbtabelle im 'project_plot.py' Program für Freibordhöhen:
Figure 3 (asar, freeboard track) / VIRTUELLE DATEN :

