Rain-induced subsurface turbulence measured using image processing methods
Rain-induced turbulence results in a relatively thin "mixed layer" at the water surface which is very important for heat and gas exchange processes at the air-sea interface and is intimately related to the rain splash products, which in turn, strongly affect radar remote sensing signals. Fluid dye, digital particle image velocimetry, and ultrasonic sounding techniques have been used in experimental tanks to investigate the subsurface turbulence caused by single and multiple raindrops impinging on a water surface. Typical eddies 10-15 mm in diameter, that have evolved from ring vortices, could be measured. The thickness of the rain-induced mixed layer was found to be 15 cm for a moderate rain rate and showed homogeneous turbulence.
References:
Lange, P.A., G. van der Graaf, and M. Gade 2000: Rain-Induced Subsurface Turbulence Measured Using Image Processing Methods, Proceed. Intern. Geosci. Remote Sens. Sympos. (IGARSS) '00, IEEE, Piscataway, NJ, USA, 3175-3177.
Background
The ocean surface experiences a gaseous exchange with the atmosphere that is modulated by wind induced water waves, surface films, and rain. If we compare an annual mean global map of CO2 (or other greenhouse gas) partial pressure differences with a seasonal precipitation map as shown below, we see that areas where high amounts of CO2 escape the ocean surface (primarily in the equatorial Pacific regions) correspond roughly to areas of high precipitation often associated with the Intertropical Convergence zone [1]. The rain induced turbulence in the upper water layer is intimately connected to the gas exchange process and must be understood in order to accurately correlate the remotely sensed backscatter from rain covered water surfaces to the rate of gas exchange. To this aim, we have attempted to determine the character of this rain-induced turbulence through experimental flow visualization and Particle Image Velocimetry (PIV) methods.
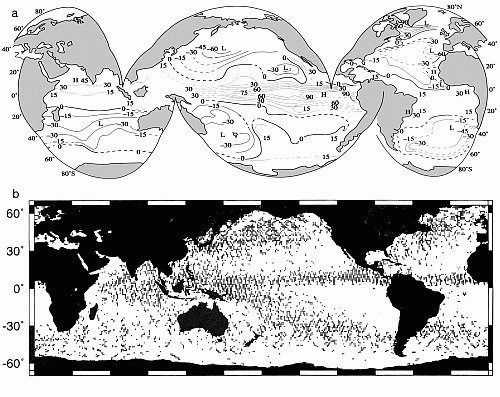
(a) Average annual differences in the partial pressure of CO2 between surface sea water and the overlying atmosphere (ppm). Positive and negative values indicate super- or undersaturated sea water resp., from [2]. (b) Location of June-August rain cases identified by the joint TOPEX/TMR rain probability index (Pj=1), from [3].
When a raindrop impacts onto a water surface, a crater and bubble form at the surface. The bubble may be closed or partially open. When open, a crown appears with significant emission of spray. The bubble subsequently collapses to form a vertical jet from which one or more secondary drops of up to more than twice the diameter of the original drop separates from the jet and subsequently falls from a height of about 2 cm onto the water surface. It is this relatively massive secondary drop that then causes subsurface turbulence often in the form of rotating fluid filaments and ring vortices.
Experiments
We have performed these experiments at the Wind Wave Tank facility of the University of Hamburg (UHH-WWK) and at the Universitat Politechnica de Catalunya (UPC), Barcelona, Spain. The UHH-WWK facility is fitted with a rain generator with an hyperdermic needle array which has been deployed for experiments on the response of X-Band radar to a rain covered water surface. The rain generator was modified to produce single and multiple dyed rain drops spaced 30 mm apart. Potassium permanganate at a low concentration (< 0.1 mol/liter) was used as a dye to insure that the drop water properties such as viscosity and density were not significantly modified by the dye. The rain drops had a diameter of 2.9 mm and were dropped from heights of 4.5m and attained an impact velocity of about 8 m/s which is about 80-85 % of their terminal velocity. A typical ring vortex produced by the secondary drop of a single dyed raindrop photographed with a 35 mm camera is shown below. The torus-type diaphanous structure is slowly sinking with a trailing entrainment "hose".
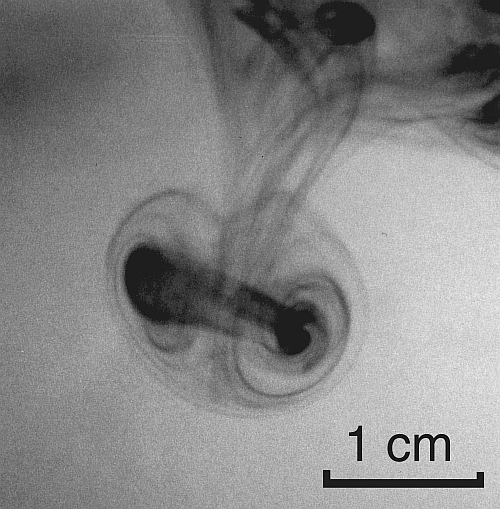
Subsurface ring vortex produced by a 2.9 mm diam. dyed raindrop falling from a height of 4.5 m.
A similar setup was arranged at the UPC using the same sized undyed drops falling from a height of 3.8 m into a small glass tank which was filled with tap water or salt water with a salinity of 35 ‰. The UPC provided us with a digital particle image velocimetry (PIV) setup (LaVision) equipped with a dual ND-YAG laser so that the subsurface rain induced turbulence could be traced in two dimensions using hollow glass spheres with an average diameter of 25 micrometers. The PIV system uses a CCD camera with 1008 x 1264 pixel resolution and was set to generate 8 frames/sec.
Results
The figure below shows a pair of image sequences depicting the development of a ring vortices culminating with an image similar to that shown in Fig.2. Each sequence shows a different drop. The upper sequence was photographed with a camcorder (Sony, Hi8), whereas the lower sequence was computed using PIV images. Though the PIV images only show a 1 mm thick slice of the turbulent structures, we can ascertain that typical velocities of up to about 16 mm/s occurred.


(a) Typical video sequence of ring vortex formation by a dyed raindrop. Time lag between panels is 0.12, 0.36, and 1,12 seconds resp. (b) Similar sequence recorded using PIV with time lags 0.125, 0.125, and 0.25 seconds.
Even more important for us, was the measurement of the thickness of the mixed layer generated by an array of raindrops falling at an approximate frequency of 4 Hz and a rain rate of 38 mm/hr. Again using dyed raindrops, we could obtain video sequences of the formation of the mixed layer as a function of time. Panel (a) of the next figure shows a layer that has more or less ceased to grow in thickness after 2.5 min. A PIV analysis of a similar situation is shown in Panel (b). One must keep in mind that the PIV analysis only shows a 2D slice of the turbulent regime. No significant difference was detected for images taken in salt water as opposed to fresh water.
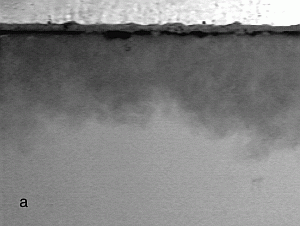
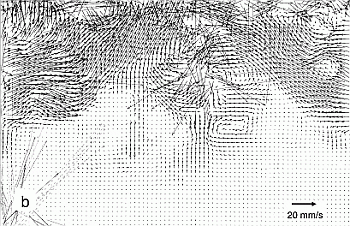
Turbulent mixed layer generated by multiple rain drops measured using (a) video of dyed raindrops and (b) similar image using PIV. The water depth shown in (a) is 30 cm and in (b) 10 cm.
By deploying an acoustic doppler velocimeter (ADV) (Nortek), which was directed and traversed vertically upward from below the mixed layer, we could obtain three dimensional velocity time series. The results are shown in the next figure for a rain rate of 38 mm/hr. The data were sampled at 25 Hz for 165 seconds for each time series. Here we also obtained velocities of up to 15 mm/s in agreement with single drop PIV measurement shown above. A very high degree of turbulence occurs at the surface where the the standard deviation reaches 50 % of the mean velocity.
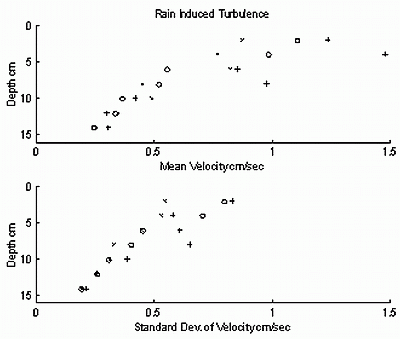
Mixed layer measured using an acoustic doppler velocimeter (z is vertical).
Conclusions
Our measurements show that typical raindrops, with an average diameter of 2.9 mm, impinging onto a water surface with 80-85% of their terminal velocity generate a mixed turbulent layer on the order of 15 cm in thickness. The layer is characterized by eddies of up to 1 cm in diameter as was shown by inspecting a single drop-induced ring vortices using dye and PIV methods. Acoustic measurements show that the mixed layer is homogeneous in three dimensions which is in good agreement with the two dimensional dye experiment.
Further laboratory work involved correlating the rain rate dependent mixed layer characteristics with gas exchange rates at the water surface. It was hoped to eventually model the mixed layer turbulence so that the gas exchange could be ascertained for remotely sensed rain covered areas.
References:
M. Varney, "The marine carbonate system," in Oceanography, by C.P. Summerhayes, and S.A. Thorpe, London: Manson Publishing, 1996, pp. 182-194.
G. Chen, "Global oceanic precipitation: A joint view by TOPEX and the TOPEX microwave radiometer," J. Geophys. Res., 102, C5, pp. 10457-10471, May 1997.

 .. back to the Wind-Wave Tank page...
 .. or to the KFEW3O page ...